
Is "White-Coat" Hyper
pp 260-266
DOI:
https://doi.org/10.7775/rac.v69i3.3061Keywords:
"White coat" hypertension, Left ventricular mass index, Stress testAbstract
Objective
Evaluation of the behavior of systolic blood pressure (SBP) during the stress test (ST),measurement of left ventricle mass index (LVMI) by 2D-echocardiography and characterization of lipid profile in"white-coat" hypertensives (WCH), and comparison of these data with those of sustained hyper-tensive (SH) and normotensive (N) subjects.
Material and method
One hundred-thirteen patients were evaluated (ages between 35 and 55 years old). Three groups were defined according to the registered office blood pressure (average of three measurements in three different visits) and daytime blood pressure, registered with ambulatory monitoring (BPAM)within seven days after office diagnosis. The blood sample was drawn the same day of BPAM.
Office blood Ambulatory daytime
pressure blood pressure
WCH > 140 and/or 90 mm Hg < 135 and 85 mm Hg SH > 140 and/or 90 mm Hg > 140 and/or 90 mm Hg N < 140 and 90 mm Hg < 135 and 85 mm Hg Within seven days of BPAM, a stress test was per-formed using a modified Bruce protocol (progressive loads with upper limit of125watts).The same day, a 2D echocardiogram at rest was also performed. Results Data was processed using ANOVA and Kruskal-Walis analysis. Two-tailed p<_0.05. Office SBP(mmHg): WCH:152 ± 8;SH:158 ±6;N:118± 5. Office DBP(mm Hg): WCH:90 ± 5;SH:92 ± 3;N:75 ± 5.Stress test 125 watt,SBP(mm Hg): WCH:211 ± 20; SH: 221 ± 17; N: 190 ± 15.LVMI in women(g/m2):WCH: 91 ±17; SH: 128 ± 50; N: 69 ±14.LVMI in men(g/m2):WCH:100±26; SH:134±30; N: 7±23. Total cholesterol(mg/dl): WCH: 237 ± 53; SH: 247 ± 53; N:207 ±42. Conclusions WCH showed a distinct behavior when compared to SH and N. Most analyzed variables showed an intermediate value between SH (highest) and N (lowest).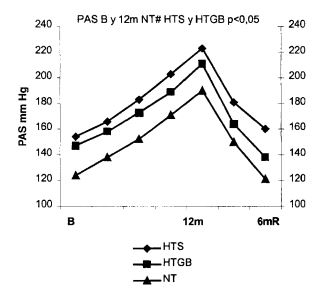
Downloads
Published
Issue
Section
License
Copyright (c) 2026 Argentine Journal of Cardiology

This work is licensed under a Creative Commons Attribution-NonCommercial-ShareAlike 4.0 International License.