
INTRODUCTION
In 2021, the global prevalence of type 2 diabetes mellitus (DM2) in people aged 20-79 years was estimated to be 10.5%, representing approximately 537 million individuals. (1) By 2045, the prevalence is projected to increase by 12.2%, equivalent to 783 million people. Healthcare costs associated with DM2, were estimated at $966 billion in 2021, and are projected to increase to more than $1 trillion in 2045. According to the Fourth National Survey of Risk Factors (2018), the prevalence of DM2 in Argentina, based on self- reporting, is 12.7%, which represents a significant increase compared with previous editions of that report. (2) This increase seems to be closely related to the sustained growth in the prevalence of obesity in the population.
Atherosclerotic cardiovascular disease continues to be the main cause of morbidity and mortality associated with DM2, (3) approximately doubling the risk of developing a wide variety of vascular diseases, independently of conventional risk factors (4). In this context, the CAPTURE study revealed that about one in three patients with DM2 has established cardiovascular disease. (5)
Based on early studies, the cardiovascular risk associated with DM2 was considered for many years to be equivalent to that of coronary heart disease. (6,7) However, with the emergence of new data, some authors have questioned this premise. (8,9) Although it is clear that patients with DM2 constitute a higher-risk population, it is likely that not all of them present the same level of vulnerability. In this context, the use of varous risk scores and additional tools, such as the detection of subclinical atheromatosis, could help to optimize cardiovascular risk stratification in this population. (10) A more accurate estimation of cardiovascular risk would allow better individualization of prevention strategies, focusing interventions of greater intensity (and greater costs) on subjects at higher risk. Although there are several tools used for cardiovascular risk estimation, and many of them have been evaluated in our population, (11) two new tools derived from the most widely used cohorts were published in mid-2023. The first is the updated 2023 American College of Cardiology (ACC) and American Heart Association (AHA) cardiovascular risk scores designed for the general population (called PREVENT, which we will refer to as AHA2023). The second is a specific tool for the diabetic population, developed in Europe, called SCORE2-Diabetes (which we will refer to as S2-DBT). (12-14) So far, we do not know how these tools would classify our patients with DM2, their relationship with other tools, and their ability to predict subclinical atherosclerotic disease.
Considering the above, the objectives of this work were: 1) To stratify cardiovascular risk in a population with DM2 in primary prevention, using different risk scores; 2) To describe the prevalence of atherosclerotic carotid plaque (ACP) in the different risk categories defined by the scores used; 3) To analyze the correlation and concordance between the different risk scores; 4) To evaluate the discriminative capacity of the different scores to identify the presence or absence of ACP.
METHODS
An observational, cross-sectional, multicenter cohort study was carried out, consecutively evaluating patients attending the cardiovascular prevention clinics of five centers located in the Autonomous City of Buenos Aires and the Province of Buenos Aires.
Patients with a diagnosis of DM2, defined by at least two fasting blood glucose values ≥126 mg/dl, blood glucose ≥200 mg/dl at 2 hours after the oral glucose tolerance test, or a glycosylated hemoglobin (HbA1c) value >6.4%, were included. (15,16) Patients with a history of acute myocardial infarction, coronary angioplasty, myocardial revascularization surgery, stroke, peripheral vascular disease, as well as patients receiving statin treatment were excluded. This last exclusion was intended to allow baseline risk stratification before any modification of the lipid profile, since this profile is a key component in the calculation of cardiovascular risk. Patients who were not receiving statins could have no medical indication or, more likely, could not be complying with the treatment despite having an indication for their use.
Laboratory data, clinical history, and usual medication were collected. Based on this information, the following 10-year cardiovascular risk scores were calculated: the Framingham score for cardiovascular disease (FrCVD) (17) and for coronary heart disease (FrCHD); (18) the ACC/AHA 2018 (AHA2018) (19) and AHA2023 risk scores; (12,13,20)
the S2-DBT for low-risk population score; (14) and the United Kingdom Prospective Diabetes Study (UKPDS) scores for fatal coronary heart disease (UKPDS-FCHD), nonfatal coronary heart disease (UKPDS-NFCHD), fatal stroke (UKPDS- FS), and nonfatal stroke (UKPDS-NFS). (21,22)
Given the availability of the method in all participating centers and the evidence supporting the presence of ACP as an independent predictor of coronary events, this tool was chosen as a surrogate marker of clinical atherosclerotic disease. (23) Ultrasound was used as a noninvasive method for ACP detection. Plaque characterization was based on the presence of the following criteria: 1) abnormal wall thickening (intima-media thickness >1.5 mm), 2) structural alteration (protrusion into the lumen or loss of alignment with the adjacent wall), and 3) abnormal wall echogenicity. The prevalence of ACP was compared between the different risk strata (quartiles) according to each of the scores used.
A Receiver Operating Characteristic (ROC) curve analysis was performed to determine the area under the curve (AUC), with the aim of evaluating the discriminative capacity of the different scores to identify the presence or absence of ACP. To establish the optimal cut-off point (OCP) for each score, the Youden index, defined as the maximum vertical distance between the ROC curve and the statistical probability line, was used.
Statistical analysis
Continuous variables with normal distribution were expressed as mean and standard deviation (SD,) and as median and interquartile range (IQR) for non-normal distribution. Comparison between groups was performed using Student's test in the case of normal distribution or the Mann-Whitney-Wilcoxon test when this condition was not met. Categorical variables were presented as percentages, and their comparison between groups was performed using the chi-square test. Due to the non-normal distribution of the scores evaluated, the correlation between the different risk scores was evaluated using Spearman's rho correlation coefficient, and was defined as null, poor, low, moderate, good or very good, if this coefficient was 0.0-0.20, 0.21-0.40, 0.41-0.60, 0.61-0.80, 0.81-1. The overall and pairwise concordance between risk scores was estimated according to the classification of patients into categories of "low/moderate" or "high/very high" cardiovascular risk, using the specific cut-off points defined for each score. The Fleiss Kappa coefficient was used to determine overall concordance and Cohen's Kappa coefficient for pairwise concordance, and were considered low, fair, moderate, good and very good, if the coefficients were <0.20, 0.21-0.40, 0.41-0.60, 0.61-0.80, or 0.81-1, respectively. A value of two tailed p<0.05 was considered statistically significant. Statistical analysis was performed using R v 4.4.2 software. (24)
RESULTS
A total of 170 patients were included in the study, mean age of 61.2 (10.8) years, 58.8% men. Mean HbA1c was 7.1 (1.3) and 14.9% were receiving insulin treatment. Median time of DM2 evolution was 5 (2-10) years. A total of 31.7% patients were overweight, 51.1% had some degree of obesity, and only 1 out of 5 was at a healthy weight. A total of 73.4 % had low-density lipoprotein cholesterol (LDL-C) levels above 100 mg/dl. In addition, 64.1 % of the patients had hypertension, 18.8 % were smokers and 3.6 % had a history of atrial fibrillation. Table 1 shows population characteristics. Median (IQR) values of FrCHD, FrCVD, S2-DBT, AHA2018, and AHA2023 scores were 18 (10.3-27.0), 29 (16.5-47.8), 9.8 (6.7-13.0), 21.7 (9.5-37.0), and 10.0 (5.8-15.0), respectively. Similarly, according to the UKPDS scores, the median values for coronary heart disease (fatal and nonfatal), fatal coronary heart disease, stroke (fatal and nonfatal), and fatal stroke were 18 (10.5-29.1), 10.7 (5.2-19.3), 8.0 (3.7-15.9), and 1.1 (0.5-2.2), respectively.
Table 1
Total population characteristics, stratified by sex.
| Continuous variables, mean (SD) or median (IQR) | Overall | Male | Female | p |
|---|---|---|---|---|
| n=170 | n = 100 | n = 70 | ||
| Age, years | 61.2 (10.8) | 61.0 (11.3) | 61.5 (10.1) | 0.761 |
| Total cholesterol, mg/dL | 200.7 (36.2) | 202.7 (40.2) | 197.8 (29.6) | 0.384 |
| LDL-C, mg/dL | 121.1 (34.1) | 126.3 (37.5) | 113.9 (27.4) | 0.021 |
| HDL-C, mg/dL | 45.7 (13.4) | 41.8 (10.4) | 51.3 (15.2) | <0.001 |
| Triglycerides, mg/dL | 172.4 (101.2) | 184.3 (115.7) | 155.4 (73.3) | 0.067 |
| Body mass index, Kg/m2 | 30.6 (5.7) | 29.9 (5.2) | 31.7 (6.1) | 0.043 |
| HbA1c, % | 7.1 (1.3) | 7.1 (1.2) | 6.9 (1.4) | 0.328 |
| DM2 evolution, years | 5 (2-10) | 6 (2-10) | 4 (2-8) | 0.101 |
| Categorical variables, n (%) | n = 170 | n = 100 | n = 70 | |
| Hypertension | 109 (64.1) | 70 (70.0) | 39 (55.7) | 0.084 |
| Active smoking | 32 (18.8) | 25 (25.0) | 7 (10.0) | 0.001 |
| Atrial fibrillation | 6 (3.6) | 6 (6.1) | 0 (0.0) | 0.097 |
| Family history of early coronary artery disease | 30 (17.6) | 23 (23.0) | 7 (10.0) | 0.047 |
| ACP | 86 (50.6) | 60 (60.0) | 26 (37.1) | 0.005 |
| Insulinized | 25 (14.9) | 18 (18.2) | 7 (10.1) | 0.223 |
ACP: atherosclerotic carotid plaque; DM2: type 2 diabetes mellitus; HbA1c: glycosylated hemoglobin; HDL-C: high-density lipoprotein cholesterol; IQR: interquartile range; LDL-C: low-density lipoprotein cholesterol; SD: standard deviation
The proportion of subjects classified as at least high risk was 71.2%, 39.9%, 53.4%, 9.8%, and 49.7% when applying the FrCVD, FrCHD, AHA2018, AHA2023, and S2-DBT scores, respectively. Regarding the UK-PDS models, the proportion of patients so categorized was 43.6%, 23.9% and 20.9% when using UKPDS- NFCHD, UKPDS-FCHD and UKPDS-NFS scores, respectively. Of note, no patient was classified with a risk ≥ 20% when applying the UKPDS-FS score.
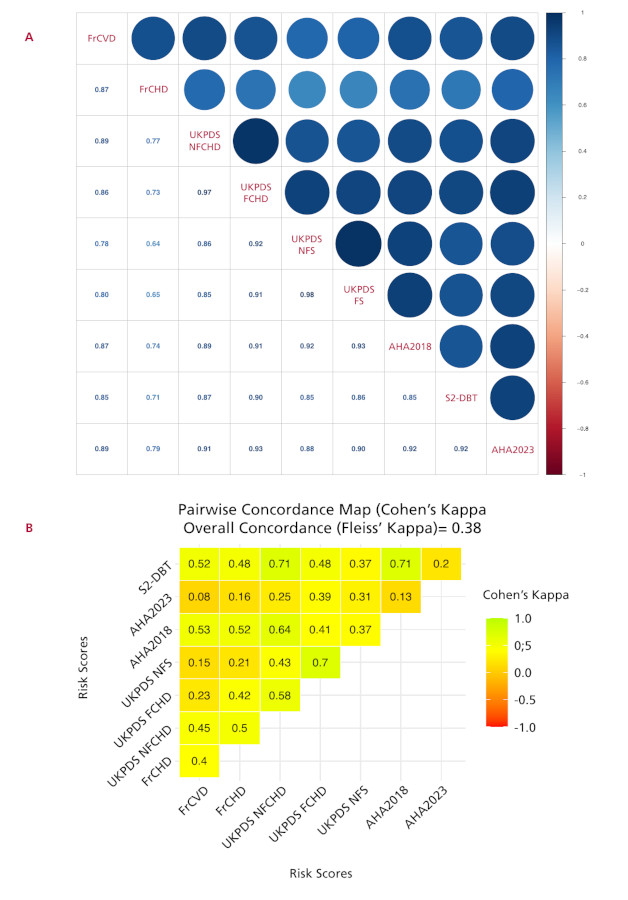
A significant correlation was observed between all the scores assessed, with Spearman´s rho coefficient values ranging from 0.64 to 0.98 (Figure 1A). However, despite this correlation, the overall concordance between scores was fair, with a Fleiss Kappa coefficient of 0.38. Pairwise agreement was evaluated for all the scores, with the exception of the UKPDS-FS score, because it classified all patients as "low/moderate risk" and the categories could not be compared. Cohen's Kappa coefficients are presented in Figure 1B.
Fig 1
Correlation and concordance between the different scores assessed. A: Correlation coefficient between the different cardiovascular risk scores. B: Overall and pairwise concordance of the different cardiovascular risk scores. The UKPDS-FS score was not evaluated since no patient was categorized as high risk. For score abbreviations see the Methods section
Overall, the prevalence of ACP was 50.6%, with a higher proportion in men than in women (60% vs. 37.1%, p=0.005). This prevalence increased progressively in the higher risk strata (quartiles) in all scores assessed. Although the highest prevalence was recorded in the upper quartile with the UKPDS-NFCHD and AHA2023 scores (95.2% and 95.1%, respectively), the range of variation within this quartile was relatively narrow (81.4% - 95.2%) (Figure 2). Patients with the presence of ACP were significantly older 62.7(7.7) vs. 55.1 (10.0) years, p <0.001, and with a lower proportion of women (30.2% vs. 52.4%, p=0.005). In addition, they had more frequent hypertension, smoking habit and a longer time of DM2 evolution compared with the group without ACP. All cardiovascular risk scores assessed showed significantly higher mean values in patients with ACP (Table 2).
Fig. 2
Prevalence of plaque, according to the cardiovascular risk quartiles of the different scores evaluated. For score abbreviations see the Methods section.
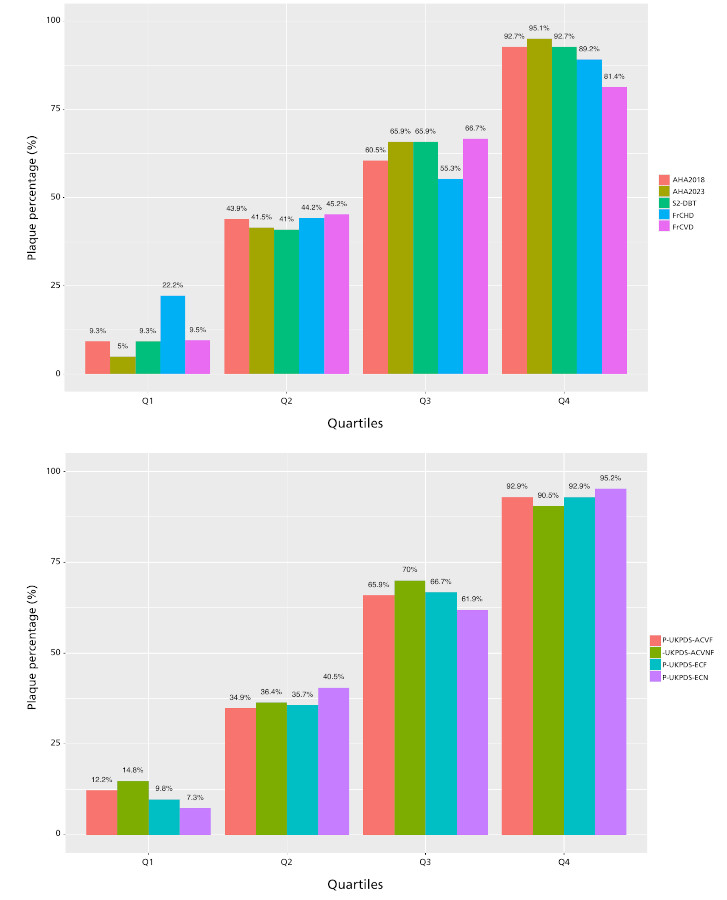
Table 2
Patient characteristics according to the presence or absence of ACP
| Continuous variables, mean (SD) or median (IQR). | Without ACP | With ACP | p |
|---|---|---|---|
| n=84 | n=86 | ||
| Age, years | 55.1 (10.0) | 67.2 (7.7) | <0.001 |
| Total cholesterol, mg/dl | 199.0 (35.9) | 202.4 (36.6) | 0.542 |
| LDL-C, mg/dl | 115.7 (32.7) | 126.4 (34.9) | 0.043 |
| HDL-C, mg/dl | 47.3 (14.7) | 44.2 (11.8) | 0.13 |
| Triglycerides, mg/dl | 185.6 (125.2) | 159.4 (68.6) | 0.092 |
| Body mass index, Kg/m2 | 31.3 (5.8) | 30.0 (5.5) | 0.158 |
| HbA1c, % | 6.9 (1.4) | 7.2 (1.1) | 0.138 |
| DM2 evolution, years | 4 (1.25-6) | 8 (3-12) | <0.001 |
| FrCVD,% | 19.6 (9.4-30.4) | 42.4 (27.4-56,8) | <0.001 |
| FrCHD,% | 13,0 (8.0-20.0) | 24.5 (16.0-31.0) | <0.001 |
| AHA2018,% | 10.1 (4.6-21.2) | 34.4 (21.6-48.7) | <0.001 |
| UKPDS-NFCHD,% | 10.7 (6.4-16.3) | 26.5 (18.6-44.1) | <0.001 |
| UKPDS-NFS,% | 4.3 (1.6-6.8) | 14.5 (8.3-29.4) | <0.001 |
| UKPDS-FCHD,% | 5.5 (2.5-10.4) | 17.8 (10.9-34.9) | <0.001 |
| UKPDS-FS,% | 0.6 (0.2-1.0) | 2.0 (1.20-4.0) | <0.001 |
| S2-DBT,% | 6.8 (4.4-9.5) | 12.9 (10.1-16.5) | <0.001 |
| AHA2023,% | 6.0 (3.8-9.4) | 13.9 (10.3-19.1) | <0.001 |
| Categorical variables, n (%) | Without ACP n=84 | With ACP n=86 | p |
| Women | 44 (52.4) | 26 (30.2) | 0.005 |
| Hypertension | 41 (48.8) | 68 (79.1) | <0.001 |
| Active smoking | 10 (11.9) | 22 (25.6) | 0.002 |
| Atrial fibrillation | 1 (1.2) | 5 (5.8) | 0.235 |
| Family history of early coronary artery disease | 15 (17.9) | 15 ( 17.4) | 1 |
| Insulinized | 10 (12.2) | 15 (17.4) | 0.46 |
ACP: atherosclerotic carotid plaque; DM2: type 2 diabetes mellitus; HDL-C: high-density lipoprotein cholesterol; IQR: interquartile range. LDL-C: low-density lipoprotein cholesterol; SD: standard deviation. For score abbreviations see the Methods section.
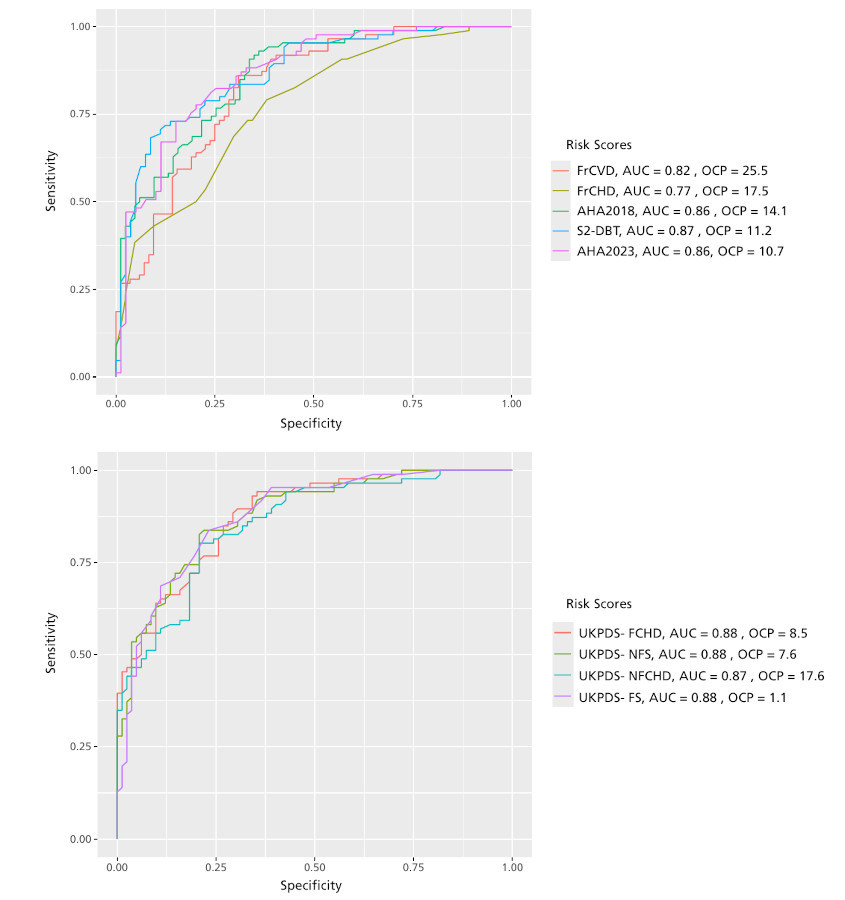
Analysis of ROC curves showed a very good predictive ability of all scores for plaque detection. The UK-PDS scores presented practically identical AUC values (≈ 0.88). Among the remaining scores, those that best classified patients were the AHA2018, AHA2023, and S2-DBT, with AUC values of 0.86, 0.86, and 0.87, respectively. As shown in Figure 3, the OCPs varied according to the score evaluated.
DISCUSSION
The identification of patients at risk of developing cardiovascular events represents one of the most complex challenges in clinical practice. Over time, various tools have been proposed to estimate the risk of future events in patients with DM2, although new cardiovascular risk calculators have recently been introduced. In our study, we compared eight predictive scales in a group of patients with DM2 without history of cardiovascular disease and analyzed their relationship with the presence of ACP.
A key point for discussion is the role of risk scores in patients with DM2 in primary prevention. The 2018 AHA/ACC guidelines for lipid management recommend administration of moderate-intensity statins in patients aged 40-75 years with DM2, and no cardiovascular history. (19) However, they suggest stratifying cardiovascular risk (AHA18S) to administer high-intensity statins in those at higher risk. An expert consensus on the role of non-statin therapies, published in 2022 by the same scientific societies, recommends in this population the administration of high-intensity statins when the calculated cardiovascular risk is equal to or greater than 7.5% at 10 years, and the addition of ezetimibe when the risk exceeds 20% and LDL-C is >70 mg/dL. (27) On the other hand, the 2023 European guidelines for the management of cardiovascular disease in patients with DM2 suggest using the S2DBT to classify patients into the following categories: low risk (<5%), moderate risk (5-10%), high risk (>10% and <20%), and very high risk (≥20%). (28) Lipid-lowering medication, the choice of antidiabetic drugs, and therapeutic targets vary according to the risk of each patient. Similarly, the latest Cardiovascular Prevention Consensus of the Argentine Society of Cardiology (SAC) follows this approach, endorsing cardiovascular risk stratification as the basis for defining the type and intensity of treatments in the patient with DM2. (29) Our study revealed that a significant proportion of persons with DM2 were classified as at least high cardiovascular risk according to most of the scores evaluated. However, this proportion varies, being lower when scores assessing a reduced number of clinical events are analyzed and, even more, if only fatal events are considered. Such is the case of the UKPDS-FS, where no patient showed a risk ≥20%. On the other hand, the scores used do not always consider the same variables. A particular case is that of the-AHA2018 and AHA2023 scores, where the difference in the classification of patients as high risk was notably greater in the former (50.4% vs. 9.8%). Unlike the 2018 calculator, PREVENT includes body mass index, estimated glomerular filtration rate, and optionally HbA1c and urinary albumin-to-creatinine ratio.
In addition, PREVENT omits ethnicity, which was included in the 2018 calculator. In fact, in other populations it has also been observed that the AHA18S tends to overestimate risk compared to the AHA2023. (30)
The concepts of concordance and correlation are widely used to assess the association between variables, but, although related, they represent different approaches. (31) Correlation focuses on the relationship between observed changes in two variables, i.e., how one varies as a function of the other. In contrast, concordance focuses on the degree of coincidence between two methods of measuring or classifying the same variable. Thus, while correlation measures association, concordance evaluates the degree of agreement between the results. In this sense, our study showed a high correlation between the different models analyzed. Previously, our research group had reported similar results in a population with DM2, though without including the new cardiovascular risk scales. (32) However, in our study, the concordance in the classification of patients as "high risk" was low or moderate among the different scores evaluated. In the general population, several studies have shown that the application of different cardiovascular risk prediction models in the same group of patients can generate discrepancies in risk classification in about 30% of cases. (33) In particular, when comparing the Framingham model with the European SCORE model, the concordance reported was mild to moderate. (34,35) Similar data have been reported in our region. For example, in Colombia, the kappa coefficient of concordance between the Framingham model and SCORE for the classification of patients as high risk was 0.28, indicating low concordance. (36) Similarly, in Peru, limited agreement was observed between the AHA/ACC equations and six different cardiovascular risk estimation scales. (37)
A recent analysis by Dziopa et al. compared the performance of 22 cardiovascular risk models, including both those designed specifically for persons with DM2 and others originally developed for the general population. The study evidenced remarkable variability in the predictive ability of these models. Surprisingly, the results indicated that models based on the general population did not necessarily underperform compared with DM2-specific models. (38) Even the non-specific scores included a small percentage of patients with DM2 in their derivation cohorts (e.g., FrCVD score 5%, FrCHD score 5.2%, and AHA2018 score between 1% and 14%, depending on the cohort evaluated). This unexpected result highlights that DM2-specific models do not necessarily outperform general models in predicting cardiovascular events. In other words, these findings challenge the assumption that incorporating DM2-related variables-such as HbA1c and disease duration-always improves risk predictive ability. (39) After adjusting for differences in population characteristics and baseline risk, recalibration significantly improved the performance of many models. This emphasizes the importance of making local adaptations of widely used models (recalibration). (40) Overall, the global prevalence of ACP in people aged 30-79 years in 2020 was estimated to be 21.1%, equivalent to approximately 816 million people affected, with 59% increase since 2000. (41) As expected, DM2 proved to be one of the risk factors most closely associated with the increased likelihood of developing ACP. In our study, we found that approximately 1 in 2 patients with DM2 had ACP. These results are consistent with previous reports. For example, a study conducted in Taiwan (42) reported a prevalence of 53.6%, whereas another conducted in China found 44.9%. (43) In the latter case, and as in our study, the authors reported that subjects with ACP were older, had longer evolution of DM2, and had a higher prevalence of hypertension. Finally, and in line with the current findings, the study previously conducted by this group of investigators showed a prevalence of ACP of 51%. (32) These findings have notable clinical implications. According to the SAC Consensus on the management of patients with DM2 and cardiovascular disease in patients with low or intermediate risk (<20%), could be useful to screen for subclinical atheromatosis, since its presence would allow the patient with DM2 to be recategorized as very high risk. (44) Furthermore, this finding justifies the intensification of lipid-lowering treatment, also prioritizing the use of antidiabetic drugs with proven cardiovascular efficacy.
Finally, in our investigation, all the scores evaluated demonstrated a very good ability to predict the presence of ACP, with AUC above 0.75. However, the OCP varied considerably among the different scores evaluated. Some showed values close to the high-risk threshold (20%) established by the guidelines recommending their use, such as the FCVS and FCDS. Similarly, S2-DBT score presented an OCP close to 10%, the threshold considered by the respective guidelines to define high cardiovascular risk. In contrast, other scores, such as the AHA2018 score and, especially, the AHA2023 score showed significantly lower OCP than the commonly used high-risk thresholds, suggesting that many patients with scores that were not as high could nevertheless present ACP.
This study has several limitations. First, it was a cross-sectional study with a small number of patients. Consequently, our findings should be confirmed in larger studies. Secondly, all participants were recruited from outpatient cardiovascular prevention clinics belonging to cardiology centers, which could have introduced a selection bias. Furthermore, this conditions its extrapolation to daily health care practice. Finally, this study did not aim to evaluate the validity of the risk scores analyzed in our country. However, we consider that our findings highlight the difficulties inherent to cardiovascular risk stratification in this population, as well as the relevance of having local adaptations of the predictive models usually employed.
CONCLUSIONS
The observed cardiovascular risk was considerable according to most of the scores assessed; however, risk stratification was heterogeneous, with adequate correlation but only modest concordance between the different scores. In other words, these findings reflect that our patients with DM2 are not uniformly classified when applying different predictive tools. The prevalence of ACP was significantly increased in strata with higher estimated risk. Understanding the relationship between the presence of ACP and different estimation tools could improve the accuracy of cardiovascular risk assessment in patients with DM2 and optimize treatment in those most likely to have an event.
Funding
None.
Conflicts of interest
None declared. (See authors' conflict of interests forms on the web).