

INTRODUCTION
Transthyretin cardiac amyloidosis (ATTR-CA) is an infiltrative cardiomyopathy caused by the extracellular deposition of amyloid as a consequence of transthyretin disaggregation and/or misfolding. (1)
Although its prevalence remains uncertain, in certain clinical scenarios such as hypertrophic cardiomyopathy (HCM), severe aortic stenosis (SAS) or heart failure with preserved left ventricular ejection fraction (HFpEF) it is usually more frequent, ranging between 13% and 17% of cases. (2,3,4,5)
In recent years, the emergence of cardiac scintigraphy (CS) with phosphonates as a non-invasive diagnostic method, together with the advent of new drugs for specific therapy, have led to a growing interest in this pathology, generating a notable increase in the diagnosis. (6)
A great advance in this regard was the identification of certain clinical, electrocardiographic and imaging variables as warning signs or "red flags" to guide suspicion and attempt to detect patients in earlier stages of the disease. However, so far, we have little evidence about the diagnostic sensitivity and specificity of each red flag, or whether there is any combination of variables that can reliably predict the presence of ATTR-CA. (7)
It is known that ATTR-CA is a slow and progressive disease, with a long asymptomatic or subclinical period. It is precisely in these stages where early diagnosis can be crucial to improve the clinical evolution and prognosis of those who suffer from this disease. Phosphonate CS imaging is highly sensitive and specific for diagnosis, when performed in the appropriate clinical context. However, to delineate when it is appropriate to perform it or not is still a challenge.
We conducted this study with the aim of developing a predictive model and subsequently a scoring scale, based on clinical, electrocardiographic and echocardiographic variables, to guide the early diagnosis of ATTR-CA.
METHODS
A single-center and retrospective study was designed. The electronic medical records of 342 patients referred to our service between January 2016 and April 2024 for CS with Tc99m-hydroxymethylene diphosphonate (HMDP) for suspected ATTR-CA were analyzed. Cardiac scintigraphy with HMDP was performed according to current guidelines. The images obtained were analyzed qualitatively according to the Perugini scale. A positive diagnosis of ATTR-CA was considered in the presence of cardiac uptake with grade 2 or 3 HMDP (in the absence of light chains in serum and urine). A negative diagnosis for ATTR-CA was considered for cardiac uptake grade 0. (8,9) Patients without previous consultations and/or studies in our institution were excluded from the analysis.
A total of 171 patients with a positive diagnosis of ATTR-CA were compared with an equal number of patients with a negative diagnosis, randomly selected from our database from a total of 564 CS with HMDP presenting with grade 0 uptake. The populations were not matched for gender or age, as both variables were shown to be predictors in other previously published scoring scales.
Clinical, electrocardiographic and echocardiographic data were analyzed in both groups. All red flags were included, except for proteinuria, global longitudinal strain and late gadolinium enhancement, which were excluded from the analysis due to high data loss.
Definition of variables
Left ventricular relaxation pattern was defined according to the following echocardiographic parameters: (10,11)
- grade I diastolic dysfunction: E/A ratio ? 0.8 + E wave ? 50 cm/s, and the absence of 2 or 3 of the following parameters: (a) E/e' ratio >14, (b) tricuspid regurgitation (TR) jet velocity >2.8 m/s, and (c) indexed left atrial (LA) volume >34 ml/m2;
- grade II diastolic dysfunction: E/A ratio ?0.8 + E wave >50 cm/s, or E/A ratio > 0.8 and <2, and the presence of 2 or 3 of the (a), (b) and (c) parameters mentioned in the previous section;
- grade III diastolic dysfunction: E/A ratio ?2
- indeterminate diastolic dysfunction when it does not meet the above criteria.
Interventricular septum (IVS) hypertrophy was defined as diastolic interventricular septum thickness ≥12 mm (12), and bilateral carpal tunnel syndrome (CTS) as the surgical history or presence of current symptoms compatible with this syndrome. (13)
Pseudo infarction pattern was defined as the presence of QS complexes in leads V1-V2, in the absence of a history of myocardial infarction, and microvoltage as the presence of QRS complexes <5 mV in frontal leads or <10 mV in precordial leads.
Statistical analysis
Quantitative variables were expressed as median with their corresponding interquartile range (IQR) and were compared with the Mann-Whitney test. Qualitative variables were expressed as percentages and were compared using the multiple chi-square test.
All the data collected were included in univariate logistic regression models. Those with statistical significance were subsequently included in multivariate logistic regression models to evaluate their predictive value in TTR-CA diagnosis.
Variables identified as predictors in the multivariate models were used to build a prediction scale with a 0-8 score. According to the ORs obtained, 1 point was assigned for ORs <7; 2 points for ORs between 7 and 21, and 3 points for ORs >21.
Sample calibration was evaluated by the Hosmer-Lemeshow statistical test. To determine the predictive capacity of the scoring scale, a receiver operating characteristic (ROC) curve was generated and the area under the curve (AUC) with its 95% CI was calculated as a measure of discrimination.
The level of statistical significance was established as p <0.05.
SPSS Statistics version 26 was used to perform the analyses.
Ethical considerations
The study was approved by the Research Committee of our institution and by an independent Ethics Committee.
RESULTS
Table 1
summarizes baseline characteristics of both groups with the variables included in the univariate analysis.
| ATTR-CA (n=171) | No ATTR-CA (n=171) | p | |
|---|---|---|---|
| Clinical Variables | |||
| Age (years) | 82 (76-86) | 82 (75-87) | 0.820 |
| Male gender | 155 (90%) | 95 (55%) | < 0.001 |
| Hypertension | 133 (78%) | 138 (80%) | 0.505 |
| Diabetes | 29 (17%) | 47 (27%) | 0.019 |
| Dyslipidemia | 104 (60%) | 110 (64%) | 0.502 |
| Smoking | 72 (42%) | 92 (53%) | 0.031 |
| History of coronary artery disease | 36 (21%) | 71 (42%) | < 0.001 |
| Narrow medullary canal | 8 (5%) | 2 (1%) | 0.054 |
| Atrial fibrillation | 89 (52%) | 101 (59%) | 0.191 |
| Biceps rupture*. | 0 | 0 | - |
| Bilateral carpal tunnel syndrome*. | 43 (25%) | 3 (2%) | < 0.001 |
| HF, LVEF ≥ 50%*. | 44 (26%) | 102 (59%) | < 0.001 |
| HF, LVEF <50%*. | 54 (32%) | 39 (23%) | 0.068 |
| Hypotension - normotension* + | 4 (2%) | 2 (1%) | 0.410 |
| Autonomic dysfunction*. | 4 (2%) | 0 | - |
| Peripheral neuropathy*. | 9 (5%) | 0 | - |
| PPM Implantation* | 44 (26%) | 53 (31%) | 0.283 |
| Family history * | 0 | 0 | - |
| Skin bruising*. | 0 | 0 | - |
| Electrocardiographic variables | |||
| Microvoltage * | 26 (15%) | 28 (16%) | 0.766 |
| Pseudoinfarction pattern*. | 54 (32%) | 48 (28%) | 0.478 |
| AVB* | 42 (25%) | 22 (13%) | 0.005 |
| LBBB | 47 (27%) | 48 (28%) | 0.903 |
| RBBB | 22 (13%) | 20 (12%) | 0.741 |
| Echocardiographic variables | |||
| IVS <12 mm | 4 (2%) | 57 (33%) | < 0.001 |
| IVS ≥12 and <16 mm | 67 (39%) | 86 (50%) | 0.038 |
| IVS ≥16 mm | 100 (58%) | 28 (16%) | < 0.001 |
| IVS (mm) | 16.6 (16.1-17.2) | 13.3 (12.6-14.1) | < 0.001 |
| LA mild dilation (35 to 41 mL/m2) | 61 (36%) | 45 (26%) | 0.061 |
| LA moderate dilation (42 to 48 mL/m2) | 55 (32%) | 44 (26%) | 0.189 |
| LA severe dilation (>48 mL/m2) | 27 (16%) | 69 (40%) | < 0.001 |
| E/e’ ratio ≥15 | 77 (45%) | 61 (36%) | 0.077 |
| LVEF >50%. | 90 (53%) | 107 (63%) | 0.062 |
| Severe AS* | 8 (5%) | 44 (26%) | < 0.001 |
| Normal relaxation pattern | 16 (9%) | 38 (22%) | 0.002 |
| Grade I diastolic dysfunction pattern | 41 (24%) | 68 (39%) | 0.003 |
| Grade II diastolic dysfunction pattern (pseudonormal) | 38 (22%) | 15 (9%) | 0.001 |
| Grade III diastolic dysfunction pattern (restrictive) | 58 (34%) | 1 (<1%) | < 0.001 |
| Indeterminate relaxation pattern | 18 (11%) | 62 (36%) | < 0.001 |
| 0 red flags | 13 (8%) | 8 (5%) | 0.260 |
| 1 red flag | 63 (37%) | 75 (44%) | 0.185 |
| 2 red flags | 66 (39%) | 54 (32%) | 0.173 |
| 3 red flags | 22 (13%) | 26 (15%) | 0.533 |
| 4 red flags | 2 (1%) | 8 (5%) | 0.054 |
| 5 red flags | 1 (<1%) | 0 | - |
AS: aortic stenosis; AVB: atrioventricular blockade; HF: heart failure; IVS: interventricular septum; LA: left atrial; LBBB: left bundle branch block; LVEF: left ventricular ejection fraction; PPM: permanent pacemaker; RBBB: right bundle branch block.
In the ATTR-CA group, male gender, incidence of bilateral CTS, peripheral neuropathy, atrioventricular block, and grade II or III diastolic dysfunction pattern were significantly more prevalent. In the group without ATTR-CA, diabetes, smoking, history of coronary artery disease, HF with left ventricular ejection fraction (LVEF) ≥50%, marked LA dilatation, and severe AS were significantly more prevalent.
Statistically significant differences in IVS thickening were also observed: most patients without ATTR-CA had thickness <12 mm or between 12 and 16 mm, with a median (IQR) of 13.3 mm (12.6-14.1), while in the ATTR-CA group the majority showed an IVS thickness ≥16mm, with a median (IQR) of 16.6 mm (6.1-17.2) .
In our analysis, microvoltage and pseudoinfarction pattern (predictor variables of ATTR-CA in other models) showed no significant differences between the two groups.
There were no patients with grade 1 cardiac uptake, nor patients with grade 0 uptake and positive serum and urine light chains.
Within the group with positive ATTR-CA, 13 patients (8%) had IVS thickness ≥12 mm without any red flags. Another 3 patients (2%) although they had red flag, did not have increased IVS thickness and, in addition, one patient had neither condition.
Four patients presented positive genetic test (hereditary ATTR-CA), the most frequent mutation being Val50Met and only one of them presented the Val142Ile variant.
Table 2 shows the multivariate analysis of the significant variables in the univariate analysis. Table 3 shows the variables identified as predictors of AC-TTR in the multivariate analysis and the score assigned to each of them, for the preparation of our prediction scale (deteCTTAR score).
Tabla 2
Multivariate analysis
| VARIABLE | OR | 95% CI | p |
|---|---|---|---|
| Male gender | 7.9 | (3.6-17.1) | <0.001 |
| BCT | 24.4 | (6.0-97.8) | <0.001 |
| LVEF >50% | 1.2 | (0.4-4.2) | 0.682 |
| AVB | 0.6 | (0.1-3.1) | 0.632 |
| IVS≥16mm | 3.6 | (1.8-7.1) | <0.001 |
| Severe LA dilation | 0.1 | (0.1-0.2) | 0.042 |
| Severe AS | 0.1 | (0.1-0.4) | <0.001 |
| Normal relaxation pattern | 0.3 | (0.1-0.8) | 0.014 |
| Prolonged relaxation pattern | 2.6 | (0.9-7.3) | 0.076 |
| Pseudonormal relaxation pattern | 4.1 | (1.2-12.9) | 0.017 |
| Restrictive relaxation pattern | 10.3 | (7.2-23.4) | 0.034 |
| Indeterminate relaxation pattern | 0.2 | (0.1-1.22) | 0.083 |
AS: Aortic stenosis; AVB: Atrioventricular block; BCT: Bilateral carpal trunnel; IVS: Interventricular septum, LA: left atrial; LVEF: Left ventricular ejection fraction; OR: Odds ratio
Table 3
Variables identified as predictors in the deteCTTAR score
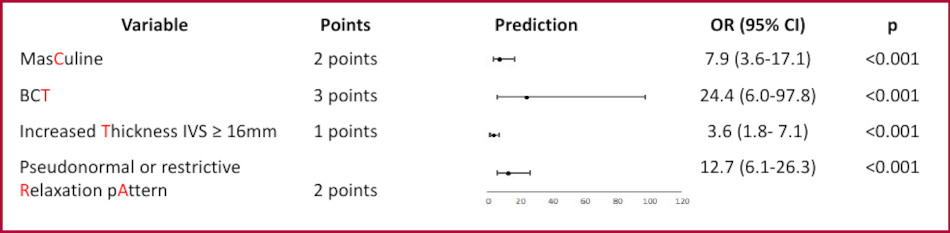
BCT: Bilateral carpal tunnel; IVS: Interventricular septum.
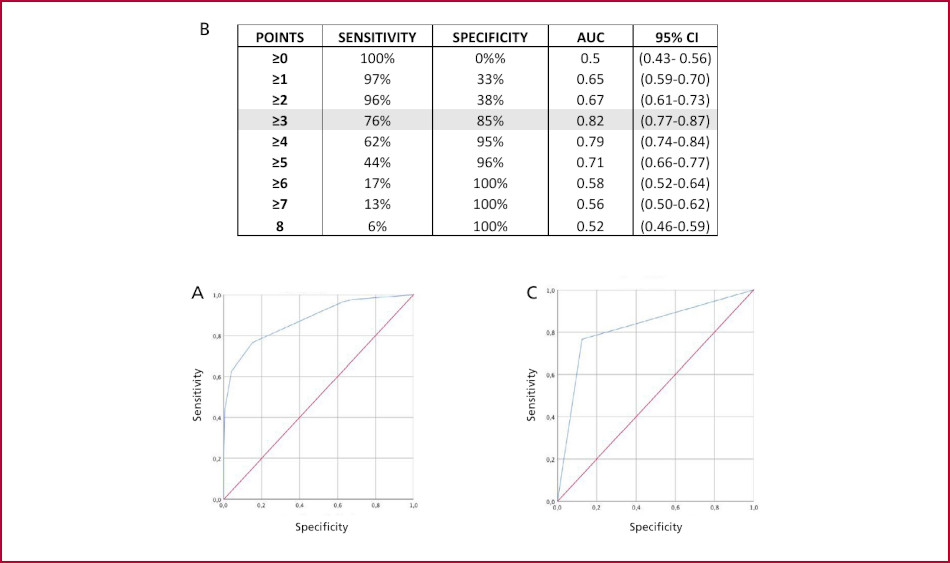
In the ROC curve analysis, the scale showed an AUC of 0.88 (95% CI 0.84-0.91, p <0.001) (Fig. 1A). A value ≥3 was identified as having the best combination of sensitivity and specificity for predicting ATTR-CA, with an AUC of 0.82 (95% CI 0.77-0.87) (Fig. 1B and C), and OR 22.9 (95% CI 12.3- 42.5, p<0.001) for having the disease.
Fig. 1
(A) ROC curve of the prediction model; (B) Sensitivity, specificity and area under curve (AUC) according to each score; © ROC curve of the ≥3 value in the scoring scale.
There was no evidence of significant differences in the number of red flags present between the groups, nor that a greater number of red flags implies a higher risk of ATTR-CA.
DISCUSSION
In our work, male gender, IVS thickness ≥ 16 mm, grade II or III diastolic dysfunction (also known as pseudonormal or restrictive relaxation pattern) and bilateral CTS were predictors of ATTR-CA.
Lack of differences in the number of red flags between patients with and without the disease confirms the low specificity of these conditions to arrive at a diagnosis.
In recent years, two scoring scales for the early diagnosis of ATTR-CA were published. One of them, the transthyretin amyloid cardiomyopathy score (ATTR-CM score) searched for ATTR-CA among patients with IVS hypertrophy and HF with LVEF ≥40%. (14)
However, according to our results, of the total number of patients with a positive diagnosis of ATTR-CA, only 44 patients (26%) had HFpEF, 73 patients (42%) showed no signs/symptoms of HF, while 54 (32%) had decreased LVEF.
Although it is known that ATTR-CA is a pathology historically related to HFpEF, it should be remembered that the natural evolution of the disease without specific treatment leads to progressive deterioration of myocardial histoarchitecture and function. Initially, the isolated deposition of amyloid fibrils affects diastolic function, but later, with excessive accumulation, sarcomere coupling is affected, damaging systolic function. (15)
Therefore, in our study, patients with decreased LVEF could be a consequence of the natural evolution of the disease (and hence, of a late diagnosis) or could be due, in some cases, to the coexistence of other diseases. It is important to emphasize that 21% of this subgroup of patients had a history of coronary artery disease. This highlights the fact that the search for ATTR-CA should not only focus on cardiomyopathies of unexplained etiology, since coexistence with ischemic-necrotic cardiomyopathy can be frequent.
In the other scale (the T-Amylo score), patients had to present as a necessary condition an IVS thickness ≥12 mm associated with one or more red flags to establish the risk of presenting ATTR-CA. (16) However, in our study, 17 patients (10%) with a diagnosis of ATTR-CA did not have increased IVS thickness or red flags.
Although the presence of ATTR-CA in patients without IVS thickening is not widely reported, one study found 5% prevalence of the disease in patients with HFpEF and IVS <12 mm. (17) This could be explained in a manner analogous to what occurs with the ischemic cascade, in which molecular methods can detect it even before changes in the electrocardiogram, motility alterations or symptoms become evident.
Both phenomena (myocardial ischemia and ATTR-CA) have a long subclinical period, in which early diagnosis is fundamental to change the prognosis of the disease. (18)
Possibly, in the case of ATTR-CA, if we wait to meet more suspicious conditions (greater IVS thickness or greater number of red flags), the diagnosis is achieved with more advanced disease and with myocardial damage already established. In addition, the new drugs approved in our country do not remove myocardial amyloid deposits, but rather stabilize the TTR molecule to prevent its disintegration, thus avoiding further accumulation. All this leads to the need of trying to establish an early diagnosis, even before the increase in IVS thickness becomes evident. (19)
Thus, the deteCTTAR score could be more comprehensive than the T-Amylo score and the ATTR-CM score, since it could discriminate the risk of ATTR-CA among patients, regardless of whether or not they meet the classic warning signs for suspicion and the LVEF value (Fig. 2 and 3)
Fig. 2
Patients without IVS hypertrophy with ATTR-CA diagnosis. Patient 1, additionally, had no red flags and patient 2 had two red flags. The three scoring scales for ATTR-CA risk assessment were compared. In both the T-Amylo score and the ATTR-CM score it is not possible to establish risk due to IVS <12mm, whereas the deteCTTAR score identified both patients as being at high risk for the disease.
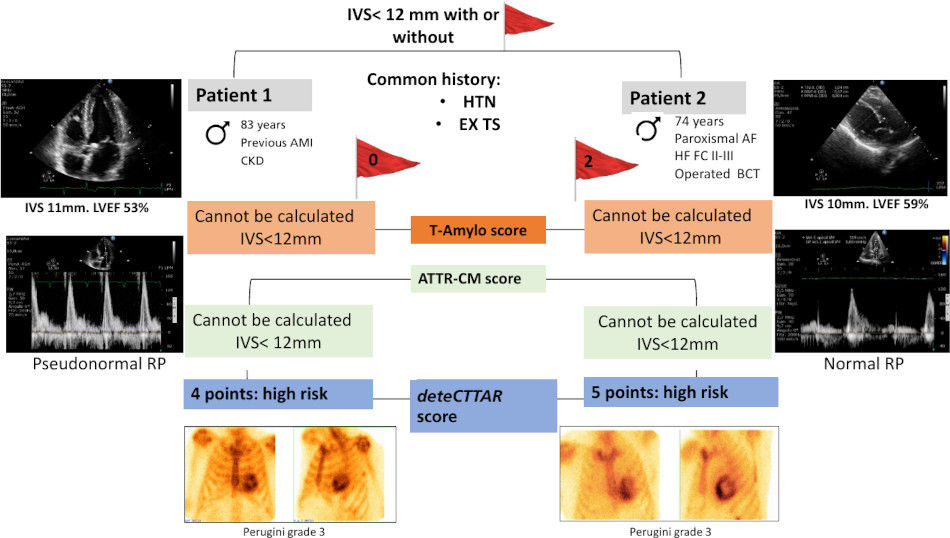
AF: Atrial fibrillation; AMI: Acute myocardial infarction; BCT: Bilateral carpal tunnel; CKD: chronic kidney disease; EX TS: Ex-tobacco smoker; HF FC. Heart failure functional class; HTN: Hypertension; IVS: Interventricular septum; LVEF: Left ventricular ejection fraction; RP: Relaxation pattern.
Fig. 3
Patients with IVS increased thickness and 4 red flags. The three scoring scales for risk assessment of ATTR-CA were compared. For patient 1 (negative ATTR-CA), the T-Amylo score predicted an intermediate risk of ATTR-CA, the ATTR-CM score a high risk, while the deteCTTAR score, a low risk. In the case of patient 2, the T-Amylo score and the deteCTTAR score predicted a high risk of developing the disease, whereas the ATTR-CM score could not be applied due to the degree of LVEF impairment.
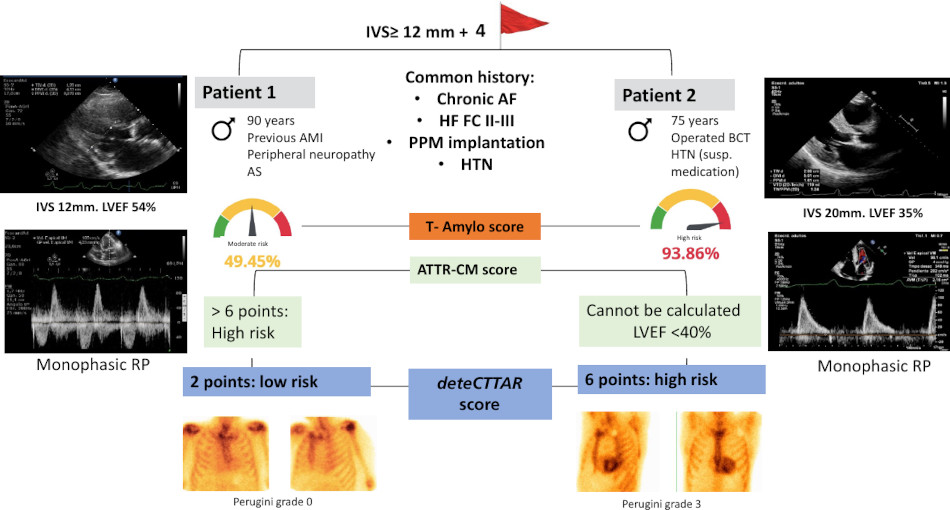
AF: Atrial fibrillation; AMI: Acute myocardial infarction; AS: Aortic stenosis; BCT: Bilateral carpal tunnel; HF FC: Heart failure functional class; HTN: Hypertension; IVS: Interventricular septum; LEFV: Left ventricular ejection fraction; PPM: Permanent pacemaker; RP: Relaxation pattern; susp: suspended
It is known that CS with phosphonates has a high sensitivity and specificity for the noninvasive diagnosis of ATTR-CA. However, there is currently no agreement in the literature on the appropriate moment to perform it.
Some guidelines propose that it should be performed directly in certain clinical scenarios, without the need to apply scoring scales to determine the risk of each patient. For others, CS should be requested only in the presence of increased IVS thickness associated with one or more red flags, HFpEF or severe AS. (20,21,22,23)
Although it is more common to find ATTR-CA among patients over 65 years of age with HFpEF and severe AS than in the general population, these variables alone were not shown to be predictors of the disease. (2,3,4,5, 24,25,26)
As for IVS thickness, there is no doubt that if it is severely increased, the difference that could exist in the measurement between different operators or machines would not have too much repercussion. However, in values close to 12 mm, an error in the measurement (due to poor technique, poor acoustic window or lack of operator experience) according to the scoring scales in force to date, would mean ruling out the diagnostic suspicion of ATTR-CA.
Previously to the ATTR-CM and T-Amylo scores, other prediction models were published but, unlike these, they only included echocardiographic and/or electrocardiographic parameters. (27,28) However, in our study, most of the variables included in these models were not predictors of ATTR-CA, with the exception of the relaxation pattern and IVS thickness.
Regarding clinical history, including red flags such as dysautonomia, peripheral neuropathy, hypotension-normotension, etc., the only one that showed a relationship with the diagnosis was having bilateral CTS.
In our scale, a score ≥3 considerably increases the risk of ATTR-CA, so that only in these cases it would be indicated to perform a CS with phosphonates. In those patients with a score between 0-2, it would not be necessary to perform it, and an alternative diagnosis should be considered (Fig. 4). If clinical suspicion persists, a cardiac magnetic resonance imaging could be performed, since its high negative predictive value would finally rule out the disease.
Fig. 4
Diagnostic algorithm proposed according to the deteCTTAR score
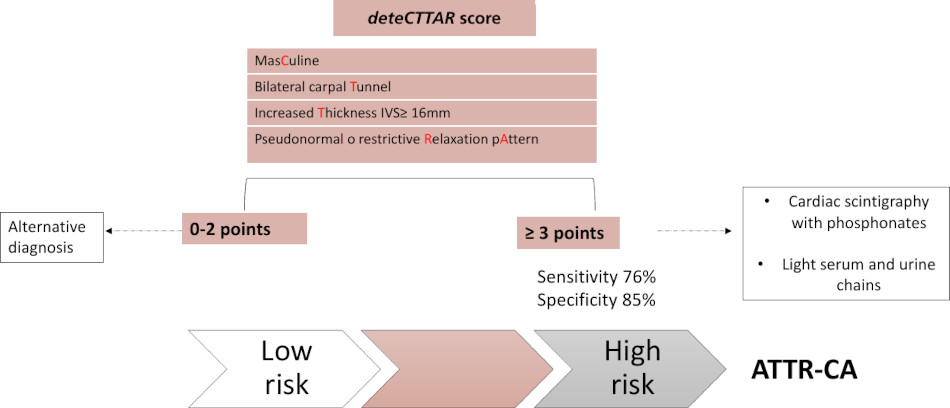
ATTR-CA: Transthyretin cardiac amyloidosis ; IVS: interventricular septum
According to our scale, the mere presence of bilateral CTS (3 points) would be a sufficient condition to request a CS with phosphonates. In these cases, in particular, the time since diagnosis and/or surgery should be considered, since amyloid infiltration of the median nerve usually precedes cardiac involvement by 5 to 9 years. Thus, a negative CS may not exclude the disease if it was performed early, so a strict cardiological follow-up would be appropriate. (29)
It should be noted that the greatest challenge encountered by all scoring scales for ATTR-CA is in patients with HCM. In the differential diagnosis with this entity, the physician's experience at the time of suspicion is fundamental, since epidemiology, family history and most of the time the electrocardiogram, can contribute to differentiate them, without the need to apply scoring scales.
The deteCTTAR score is the first score for the prediction of ATTR-CA developed with patients in our country. It can be applied in the office to any patient without the need to wait for conditions (red flags) that may delay diagnosis, using data obtained from the interrogation and a baseline echocardiogram.
Limitations
The study design was single-center, retrospective, with a relatively small database, so there could be an overfitting of the model.
The low number of patients causes the 95% CI of some predictors to be very wide, which implies lower prediction accuracy.
Although our data are encouraging, they require external validation in the future with a larger sample of patients.
CONCLUSIONS
The presence of increased IVS thickness associated with one or more red flags was not a necessary condition for the diagnosis of ATTR-CA.
The prediction model obtained allowed the development of a scoring scale that demonstrated high sensitivity and specificity to strongly guide the diagnosis of ATTR-CA.
A score ≥3 in the deteCTTAR score significantly increases the risk of ATTR-CA.
Conflicts of interest
None declared. (See authors’ conflicts of interest forms on the web)
Financing
None.