

Introduction
Hemodynamic monitoring is an essential component for the management of critically ill patients, and cardiac output (CO) is recognized as one of the primary indicators of circulatory status. Throughout history, Fick’s method and thermodilution via a pulmonary artery catheter (PAC) have been considered the gold standard. Their invasive nature entails significant risks, including arrhythmias during insertion (ranging from 12.5% to over 70%). Clinically significant ventricular arrhythmias occur in less than 1%. Catheter-associated bacteremia is another complication occurring in approximately 1.3%–2.3% of cases. (1,2) These limitations have driven the development of less invasive or noninvasive alternatives for assessing hemodynamic status.
Among minimally invasive methods, transpulmonary thermodilution—as represented by devices such as PiCCO— (3,4) uses a central venous catheter and an arterial catheter, although it has limitations in patients undergoing extracorporeal therapies or with intracardiac shunts. Transpulmonary lithium dilution, (5,6) available in systems such as LiDCO, requires the injection of lithium chloride and an arterial sensor, which limits its use in patients undergoing lithium therapy or exposed to certain muscle relaxants. Arterial pressure waveform analysis using the FloTrac/Vigileo or MostCare systems is another alternative that estimates beat-by-beat stroke volume without requiring calibration in some systems. Nevertheless, the accuracy of this analysis may be reduced in states of vasoplegia or in the presence of ventricular assist devices. (7-9) The accuracy of these methods may be limited in patients with pacemakers, pulmonary hypertension, or severe valvular regurgitation. (10,11) Transthoracic and transesophageal Doppler echocardiography provide information on blood flow and cardiac morphology, but require specific training and exhibit interobserver variability. In addition, esCCO system, based on pulse oximetry, electrocardiography, and peripheral pulse wave analysis, has demonstrated a favorable correlation with thermodilution in selected studies. (9-12) However, the evidence regarding these techniques is characterized by significant methodological heterogeneity, small sample sizes, and limited safety information, although the incidence of adverse effects appears to be low. (12) Furthermore, costs are variable, ranging from esophageal Doppler—an affordable option—to PiCCO, one of the most expensive minimally invasive alternatives. (9-12)
In this context, infrared thermography emerges as a promising, fully noninvasive, and low-cost tool that captures infrared radiation from tissues and helps identify abnormalities in peripheral perfusion. Its clinical potential has been evaluated in heart failure, where recent studies have shown that, when combined with artificial intelligence (AI) algorithms, it can differentiate patients with acute decompensated heart failure from controls, with an interesting sensitivity and an area under the ROC curve of 0.82. (13) Similarly, ocular surface temperature, measured using thermography, has shown a correlation with core body temperature (14, 15) and an association with cardiovascular outcomes, such as acute myocardial infarction and long-term prognosis in animal models. (16) This evidence suggests that infrared thermography could become a diagnostic and clinical monitoring tool applicable in critical care settings and telemedicine contexts, providing a safe and accessible alternative to current hemodynamic strategies.
Methods
We conducted a cross-sectional study in the Critical Care Cardiology Unit of two tertiary hospitals. We included patients consecutively admitted and undergoing invasive PAC monitoring, indicated by clinical criteria independent of this protocol. Patients with a history of facial surgery or trauma, severe facial edema, active infections, ocular or facial devices, and any condition that could alter anatomy or thermal patterns were excluded from the study. The study protocol was approved by the institutional review board and complied with the Declaration of Helsinki. (17)
For each patient, three serial facial thermal images were obtained using a portable infrared camera (FLIR ONE®, FLIR Systems Inc.) with a resolution of 160 × 120 pixels and a spectral range of 8–14 μm. The photos were taken simultaneously with three hemodynamic measurements obtained using the PAC, and the values were averaged for analysis. The photos were taken in the supine position, 10 cm from the face in a room with controlled environmental temperature, avoiding the influence of external heat sources or drafts.
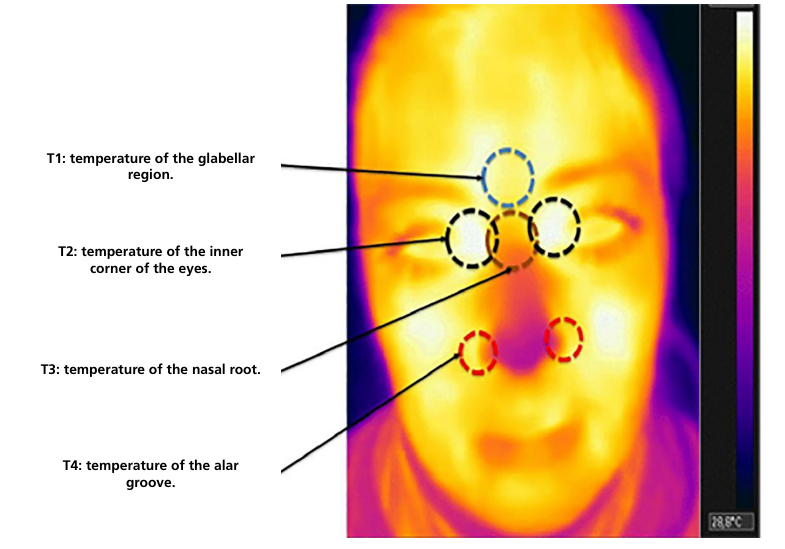
The images were analyzed using specialized thermography software. A blinded evaluator selected six facial regions of interest: forehead, right cheek, left cheek, nose, and the inner corners of both eyes. Three types of variables were calculated in these regions: 1) individual temperatures per region (T), 2) average temperatures across different regions (AT), and 3) thermal gradients between regions (TG) (Figure 1). Subsequently, a second blinded evaluator compared the thermal parameters with the hemodynamic variables obtained via the PAC.
Figure 1
Facial thermographic image of a patient acquired with an infrared camera (FLIR ONE). The regions measured are indicated: T1 (glabellar region), T2 (inner corner of the eyes), T3 (nasal root), and T4 (alar groove). The color scale indicates temperature variations in °C.
Thermal data were processed using machine learning to identify the optimal predictive model for a cardiac index (CI) < 2.5 L/min/m², defined as low cardiac output.
Qualitative variables are expressed as numbers and percentages and quantitative variables are expressed as mean and standard deviation. The association between categorical variables was explored using the chi-square test or Fisher’s test, while the Student’s t test or the Wilcoxon rank sum test was used for quantitative variables. The Pearson or Spearman correlation coefficients were used to measure the relationship between quantitative variables. A p-value < 0.05 was considered statistically significant. Discriminative ability was evaluated using ROC curves and calculating the area under the curve (AUC), along with sensitivity, specificity, and predictive values. The study protocol was approved by an institutional review board. Patients’ identities were protected because the characteristics of the thermal images do not allow for facial identification.
Results
A total of 18 patients underwent 35 hemodynamic monitoring sessions, with 9 patients undergoing 2 or more monitoring sessions. Mean age was 60 ± 14 years and 70% were men. The causes of hospitalization were heart failure in 50% of cases, postoperative care following cardiovascular surgery in 39%, and non-cardiovascular causes in 11% of cases. The indication for hemodynamic monitoring was shock in 60% of cases, and postoperative complications following cardiovascular surgery in 40%. Seventeen (94.4%) patients required vasoactive drugs; 2 drugs or greater were used in 19 (54.3%) monitoring sessions. These agents included dobutamine and norepinephrine in more than 50% of cases, milrinone in 27%, and epinephrine and nitroglycerin in < 10%.
During hemodynamic monitoring with the PAC, CO was calculated using the thermodilution method in 31 measurements (88.6%). Low cardiac output occurred in 18 cases (51.4%), with the following values: mean arterial pressure (MAP), 74.5 ± 7.8 mmHg; heart rate (HR), 95.7 ± 21.2 beats/min; mean pulmonary artery pressure (MPAP), 26.2 ± 8.7 mmHg; pulmonary capillary wedge pressure (PCWP), 12.2 ± 4.9 mmHg; central venous pressure (CVP), 7.3 ± 4.2 mmHg; cardiac index (CI), 2.6 ± 0.6 L/min/m²; systemic vascular resistance (SVR) 1123.3 ± 260.1 dyn·s cm⁻⁵; and pulmonary vascular resistance (PVR), 168 ± 87.4 dyn·s·cm⁻⁵. Twenty-five percent of patients were on mechanical ventilation.
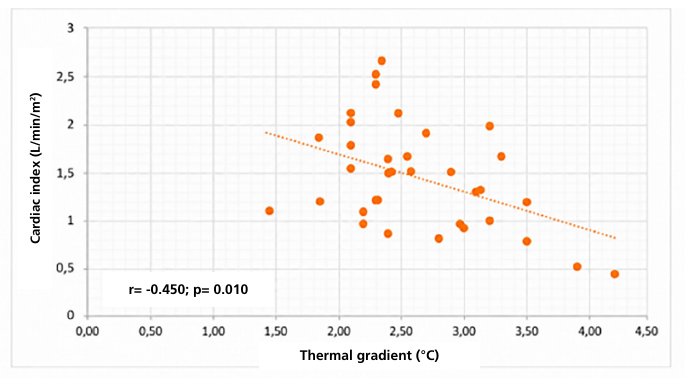
A total of 105 thermographic images were obtained. The thermal data that showed the strongest correlation with the CI were, respectively: T1, 35.55 ± 1.84 °C (r = 0.42, p = 0.010); T3, 34.48 ± 2.45 °C (r= 0.37, p = 0.021), T4, 35.74 ± 1.48 °C (r = 0.41, p = 0.012), AT1 (average between T1 and T4), 34.99 ± 1.47 °C (r = 0.43, p = 0.014) and GT (gradient between T1 and AT1), 1.32 ± 0.59°C (r = −0.45, p = 0.010). There were also some significant correlations between SVR and CVP (Table 1), but not with PCWP, HR, MPAP and MAP. Except for T2, all thermal measurements correlated with CI, and the best value was obtained with TG (Figure 2).
Table 1
Thermal values and their correlation with cardiac index.
| Hemodynamic variable | T1 | T2 | T3 | T4 | AT=1 | AT=1 |
|---|---|---|---|---|---|---|
| CVP | r = 0.42; p = 0.010 |
r = 0.32; p = 0.506 |
r = 0.37; p = 0.020 |
r = 0.35; p = 0.033 |
r = 0.4; p = 0.010 |
NS |
| MPAP | NS | NS | NS | NS | NS | NS |
| PCWP | NS | NS | NS | NS | NS | NS |
| MAP | NS | NS | NS | NS | NS | NS |
| HR | NS | NS | NS | NS | NS | NS |
| CI | r = 0.42; p = 0.010 |
NS | r = 0.37; p = 0.021 |
r = 0.41; p = 0.012 |
r = 0.43; p = 0.010 |
r = -0.45; p = 0.010 |
| SVR | r = -0.36; p = 0.030 |
NS | r = -0.35; p = 0.041 |
r = -0.44; p = 0.010 |
r = -0.41; p = 0.010 |
NS |
| PVR | NS | NS | NS | NS | NS | NS |
CI: cardiac index; CVP: central venous pressure; HR: heart rate; MAP: mean arterial pressure; MPAP: mean pulmonary artery pressure; NS: non-significant; PCWP: pulmonary capillary wedge pressure; PVR: pulmonary vascular resistance; SVR: systemic vascular resistance; T: individual temperature by region; TG: thermal gradient; TP: average temperature.
Figure 2
Correlation between facial thermal gradient (TG) and cardiac index (CI). A significant inverse association is observed (r = –0.45; p = 0.01).
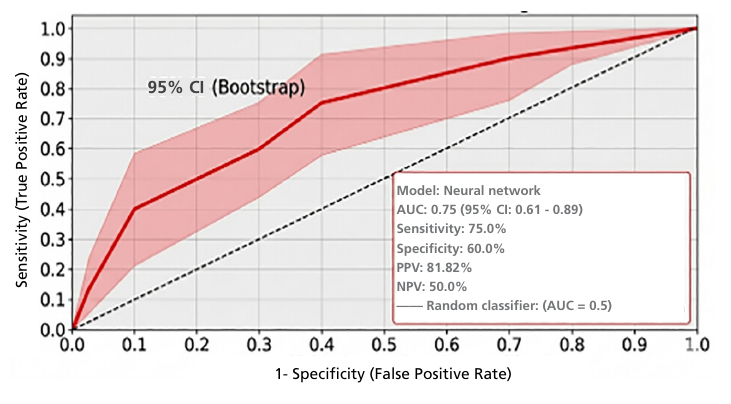
The best model to predict low cardiac output with the use of AI was a neural network with an AUC-ROC of 0.75 (95% CI 0.61–0.89), sensitivity of 75.0%, specificity of 60.0%, positive predictive value of 81.82%, and negative predictive value of 50.00% (Figure 3).
Discussion
This study demonstrates that infrared facial thermography, integrated with AI, can identify significant correlations with CI, particularly through thermal gradients. These findings are consistent with previous evidence demonstrating that thermography had a sensitivity of 84% and a specificity of 52% to detect acute decompensated heart failure. (13) Additionally, recent studies describe how skin thermoregulation is abnormal in heart failure, with a slower and reduced thermal response during exercise, particularly in patients with reduced ejection fraction. (18,19) This thermal dysfunction reflects impaired peripheral perfusion and progression toward advanced stages of the disease.
It is worth noting that the correlation between peripheral temperature and CI is not a novel finding. (19,20) In 1969, Joly and Weil published a pioneering study demonstrating that hallux temperature was a sensitive marker of peripheral hypoperfusion and correlated with cardiac output in patients with shock. (21) That paper laid the physiological basis for considering skin temperature as an indirect reflection of circulatory status, predating modern applications of thermography by several decades. Our results extend this observation to facial thermal analysis, further incorporating AI algorithms to optimize diagnostic capability.
The strength of this study lies in a standardized protocol using simultaneous thermal imaging with invasive CI monitoring in critically ill patients, regional facial analysis, and AI-driven processing. This enabled robust correlations with CI, providing a novel diagnostic approach. This is the first report to combine facial thermography, simultaneous invasive monitoring, and AI-driven analysis, offering a fully noninvasive, rapid, and cost-effective tool with potential applications in telemedicine and critical care.
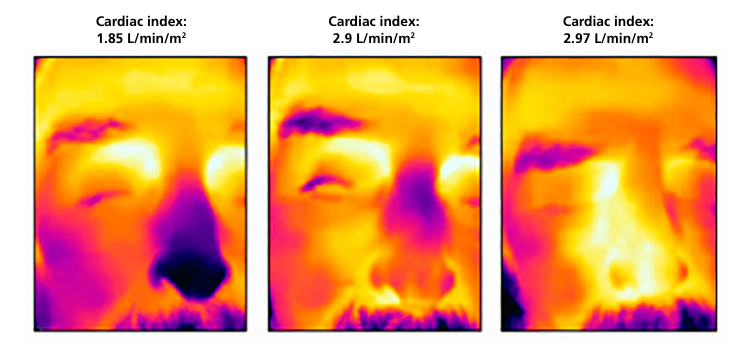
However, some limitations should be considered. The modest sample size and clinical heterogeneity —with a high proportion of patients presenting with shock or post-cardiac surgery— restrict the generalizability of the results. Furthermore, the predictive ability of the AI-driven model, with an AUC of 0.75, is promising but requires external validation in larger and more homogeneous cohorts. It is not yet known whether these thermal patterns vary among specific subtypes of heart failure (based on ejection fraction, among other factors). Additionally, the temporal evolution of thermal patterns following hemodynamic interventions was not evaluated—although individual patient analyses revealed thermal–hemodynamic concordance (Figure 4)— nor was its utility explored in outpatient or remote monitoring.
Figure 4
Facial thermographic images of a patient with cardiogenic shock across three distinct hemodynamic states. From left to right, a progressive improvement in cardiac index (1.85, 2.9, and 2.97 L/min/m²) is observed, with the corresponding thermal changes on the color scale (white = higher temperature, black = lower temperature).
In line with recent reviews, medical thermography has multiple valid applications, such as the early detection of vascular or inflammatory changes, and detection of subtle thermal variations that precede structural abnormalities. (14) However, it is essential to remember that thermography is a complementary physiological tool and does not replace conventional structural methods, such as echocardiography or cardiac catheterization, among others. As such, thermography could serve as a novel complementary diagnostic tool in critical care, and its integration with AI offers clear advantages over current alternatives due to its noninvasive, rapid, and cost-effective nature.
Conclusions
Infrared facial thermography showed an association with cardiac index in critically ill patients, with the thermal gradient being the variable with the strongest correlation. Integration with artificial intelligence enabled the identification of a physiological signal with potential utility for detecting low cardiac output.
Given the exploratory nature of the study, the limited sample size, and the absence of external validation, these findings should be interpreted with caution. Prospective studies with a larger number of patients and robust analytical method are needed to confirm the diagnostic value and define the applicability of this method.
Acknowledgments
We are grateful to the critical care teams at the participating hospitals.
Financiamiento:
This research did not receive any specific grant.