María J. Rudi 1, Nicolás M. Kouyoumdzian 1, 2, Melanie Kim 1, Natalia L. Rukavina Mikusic 1, 2, Hyun J. Lee 1, Mónica Galleano 3, 4, Belisario Fernández 5, Ana Puyó 1, Marcelo R. Choi 1, 2, 5
1 University of Buenos Aires (UBA). School of Pharmacy and Biochemistry (FFyB). Department of Biological Sciences, Chair of Anatomy and Histology. Buenos Aires, Argentina.
2 CONICET-UBA, Alberto C. Taquini Institute of Translational Medicine Research (IATIMET). Buenos Aires, Argentina.
3 CONICET-UBA, Institute of Biochemistry and Molecular Medicine (IBIMOL). Buenos Aires, Argentina.
4 UBA. FFyB. Department of Analytical Chemistry and Physical Chemistry, Chair of Physical Chemistry. Buenos Aires, Argentina.
5 Fundación H.A. Barceló, University Institute of Health Sciences. CABA, Argentina.
Address for reprints: Julieta Rudi. E-mail: mjulietarudi94@gmail.com
Rev Argent Car diol 2024;92:130-138. http://dx.doi.org/10.7775/rac.v92.i2.20753
ABSTRACT
Background: Excessive consumption of salt (sodium chloride, NaCl) in the diet leads to the development of hypertension (HTN) and target organ damage. It is known that the ClC-K1 and ClC-5 channels are essential regulators of the chloride (Cl-) anion, but the contribution of this anion to salt-harmful effects remains unknown.
Objective: The aim of this study was to evaluate the participation of Cl- in the renal inflammatory and oxidative response and in the development of HTN.
Methods: Male Wistar rats were divided into four groups (n=8/group) and fed with different diets for 3 weeks: control (C group); NaCl 8% (NaCl group); high Na+ diet: sodium citrate (Na3C6H5O7) 11.8% (Na group); high Cl- diet: calcium chloride (CaCl2) 3.80%, potassium chloride (KCl) 3.06% and magnesium chloride (MgCl2) 1.30% (Cl group). Systolic blood pressure (SBP), renal function, oxidative stress and inflammation markers in the renal cortex, and renal expression of the chloride ClC-K1 and ClC-5 channels were assessed.
Results: An increase in SBP, glutathione peroxidase (GPx) activity, and renal expression of nuclear factor kappa B (NFkB) and angiotensin II type 1 receptor (AT1R) were observed in the NaCl and Cl groups (p<0.05). The production of thiobarbituric acid reactive substances (TBARS) increased in the experimental groups compared with C. The expression of Parkinson disease protein 7 (PARK7) decreased in the Cl group compared with C (p< 0.05). The NaCl and Cl groups showed increased expression of ClC-K1, while ClC-5 was reduced in the NaCl group compared with C (p<0.05)
Conclusion: Cl- would be co-responsible together with Na+ in triggering oxidative and inflammatory kidney damage and increasing blood pressure. This indicates the importance of reducing the intake of both ions as a non-pharmacological preventive measure for the prevention and control of HTN. The role of ClC-K1 and ClC-5 channels as mediators of this process remains to be confirmed.
RESUMEN
Introducción: El consumo excesivo de sal (cloruro de sodio, NaCl) en la dieta conduce al desarrollo de hipertensión arterial (HTA) y daño de órgano blanco. Se sabe que los canales ClC-K1 y ClC-5 son reguladores esenciales del anión cloruro (Cl-), pero la contribución de este anión a los efectos deletéreos de la sal es aún desconocida.
Objetivo: El objetivo de este trabajo fue evaluar la participación del Cl- en la respuesta inflamatoria y oxidativa renal y en el desarrollo de HTA.
Material y métodos: Ratas Wistar macho se dividieron en cuatro grupos (n=8/grupo) y se alimentaron con diferentes dietas durante 3 semanas: control (grupo C); NaCl 8 % (grupo NaCl); dieta alta en Na+: citrato de sodio (Na3C6H5O7) 11,8 % (grupo Na); dieta alta en Cl-: cloruro de calcio (CaCl2) 3,80 %, cloruro de potasio (KCl) 3,06 % y cloruro de magnesio (MgCl2) 1,30 % (grupo Cl). Se determinó la presión arterial sistólica (PAS), función renal, marcadores de estrés oxidativo y de inflamación en corteza renal, y la expresion renal de los canales de cloruro ClC-K1 y ClC-5.
Resultados: Se observó un aumento de la PAS, actividad de glutatión peroxidasa (GPx) y expresión renal de factor nuclear kappa B (NFkB) y receptor de angiotensina II tipo 1 (AT1R) en los grupos NaCl y Cl- (p<0,05). La producción de sustancias reactivas del ácido tiobarbitúrico (TBARS) aumentó en los grupos experimentales con respecto a C. La expresión de la proteína de Parkinson 7 (PARK7) disminuyó en el grupo Cl en comparación con C (p< 0,05). Los grupos NaCl y Cl- mostraron una mayor expresión de ClC-K1, mientras que ClC-5 se redujo en el grupo NaCl en comparación con C (p<0,05).
Conclusión: El Cl- sería corresponsable, junto con el Na+, de desencadenar daño oxidativo e inflamatorio renal y aumentar la presión arterial; por ello se deduce la importancia de reducir la ingesta de ambos iones como medida preventiva no farmacológica para la prevención y
Palabras clave: Anión cloruro - Catión sodio - Cloruro de sodio - Hipertensión arterial - Canales de cloruro
Received: 12/05/2023
Accepted: 02/12/2024
INTRODUCTION
Excessive consumption of sodium chloride (NaCl) in the diet is a risk factor for the development of hypertension (HTN) and target organ damage. In the kidney, salt overload induces oxidative stress and inflammation, independently of the blood pressure value. Clinical studies suggest that blood pressure is not increased by a high Na+ diet in the absence of chloride anion (Cl-), (1-3) since sodium bicarbonate does not have the same pressor effect as NaCl in hypertensive people. (2,4) The most recent studies suggest that chloride may have a more specific role in “salt-sensitive” hypertension, independent of the hypertensive effect of sodium. (5-7)
On the other hand, it is known that chloride channels closely regulate the concentrations of this anion in both the intracellular and extracellular compartments. These channels are classified into four groups: family of chloride channels (ClCs), calcium-activated chloride channels (CaCCs), cystic fibrosis transmembrane conductance regulators (CFTR) and γ-aminobutyric acid type A (GABAA) receptors. ClCs constitute a large family of voltage-gated channels and is the family of chloride channels most involved in the development of HTN. (8-14) They include nine subtypes: ClC-1 to ClC-7, ClC-K1, and ClC-K2. (15) It has recently been shown in vitro that high concentrations of NaCl decrease the expression levels of ClC- 5. (16) Finally, it is known that high concentrations of NaCl are associated with an increase in the renal expression of the ClC-K1 channel. (17) However, it is unknown what effects a diet rich in chlorides has on the expression of these channels.
The aim of this work was to evaluate whether the Cl- anion, in addition to the Na+ cation, would be involved in the renal inflammatory and oxidative response and in the development of HTN.
METHODS
Animals and diets
Male, 7-week-old Wistar rats with average body weight (BW) of 155-165 g at the beginning of the diet were used. They were divided into a control group and three experimental groups (n=8/group) and were fed different equimolar diets and ad libitum tap water for 3 weeks:
1) Control: normal sodium and chloride diet (C Group);
2) NaCl 8% W/W: high-sodium and high chloride diet (NaCl Group);
3) High in Na+ without Cl-: high-sodium and normal chloride diet (sodium citrate, Na3C6H5O7, 11.8% W/W) (Na Group);
4) High in Cl- without Na+: high chloride and normal sodium diet (calcium chloride, CaCl2, 3.80%; potassium chloride, KCl, 3.06% and magnesium chloride MgCl2, 1.30% W/W) (Cl Group).
The diets were prepared by the Nutrition Chair of the Faculty of Pharmacy and Biochemistry, of the University of Buenos Aires (UBA).
Assessment of systolic blood pressure (SBP)
Systolic blood pressure was assessed at time 0 (baseline), and at weeks 1, 2 and 3 using the plethysmographic method in the rat's tail.
Assessment of urinary and plasma parameters and evaluation of renal excretory function
After 3 weeks of diet, the animals were housed in metabolic cages for two days: one for acclimatization and another for 24-hour urine collection to measure diuresis, urinary concentrations of Na+ and Cl- (mEq /L) and creatinine (mg/dL).
On the day of euthanasia, while under anesthesia, blood was drawn from the retroocular sinus. Plasma concentrations of Na+, Cl-, creatinine, glucose and urea were measured using an autoanalyzer. Plasma osmolarity (mOsm/kg) was estimated as: 2*natremia (mEq/L) + 1/18*glycemia (mg/dL) + 1/6*uremia (mg/dL).
Creatinine clearance (CrCl) was calculated according to:
CrCl = (urine creatine/serum creatinine) * diuresis/time/ BW.
The filtered load (FL) and the parameters of renal excretory functionality, urinary excretion (UE) and fractional excretion (FE) of the different ions, were determined, based on the following standard formulas:
FLNa = CrCl * serum sodium
UENa = diuresis * urinary sodium
FENa = (UENa/FLNa)*100
FLCl = ClCr * serum chloride
UECl = diuresis * urinary chloride
FECl = (UECl/FLCl)*100
Diuresis, CrCl, FL, and UE were normalized by the BW of each rat and are expressed in mL/day/kg, mL/min/kg or mEq/day/kg, while FE is expressed as percentage (%).
Euthanasia, kidney removal and sample processing
Assessment of TBARS and enzymatic activity
TBARS content was assessed fluorometrically in renal cortex homogenates. (19) Results are expressed as TBARS nmol of malondialdehyde (MDA) equivalents/mg protein.
GPx activity was measured spectrophotometrically following the enzymatic oxidation of NADPH at 340 nm in the presence of 1 mm glutathione (GSH), 1 mm sodium azide (NaN3), 0.15 mm nicotinamide adenine dinucleotide phosphate (NADPH) and 0.25 units (U)/mL of glutathione reductase. The results are expressed in μmol oxidized NADPH/ mg protein/min, which is equivalent to μmol oxidized glutathione (GSSG)/mg protein/min). (20)
Western Blot
To assess the expression of the nuclear factor kappa B (NFkB) protein, glutathione peroxidase (GPx), angiotensin II type 1 and 2 receptors (AT1R, AT2R), Parkinson disease protein 7 (PARK7), ClC-5 and ClC-K1, 120 μg of proteins were diluted in sample buffer and separated by electrophoresis in acrylamide gels under denaturing conditions (SDS 10%). Then, they were electrotransferred to a nitrocellulose membrane. Subsequently, the membranes were blocked for 1 h at room temperature with 3% nonfat dry milk diluted in tris buffered saline (TBS)-Tween. They were incubated overnight at 4°C with the corresponding primary antibodies, which were diluted 1:1000 in phosphate buffered saline (PBS). After 1 h of incubation with the respective secondary antibodies conjugated with horseradish peroxidase (1:2000), and 1 h of incubation with Streptavidin-Peroxidase (1:2000), the proteins were revealed using a chemiluminescence kit. The bands obtained were analyzed using the ImageJ program. The results were normalized to values of β-actin, β-tubulin, or glyceraldehyde 3-phosphate dehydrogenase (GAPDH).
Kidney histology
The kidneys were fixed in 10% formaldehyde to subsequently follow the conventional histological technique consisting of paraffin embedding, 7-μm thick tissue sections with a microtome and staining with hematoxylin-eosin (H-E). Then, the histological preparations were qualitatively analyzed with a bright-field optical microscope coupled to a digital camera (Nikon).
Statistical analysis
The results are expressed as mean ± standard error of the mean (SEM). A two-way analysis of variance (ANOVA) and the Tukey test were used to analyze the data using the InfoStat program. Differences with p <0.05 were considered statistically significant.
Ethical considerations
The experimental protocol was approved by the Institutional Committee for the Care and Use of Laboratory Animals (CICUAL) of the Faculty of Pharmacy and Biochemistry of the University of Buenos Aires (UBA) under resolution N°1881/2019. The procedures were carried out following the instructions of the “Guide for the care and use of laboratory animals”. (21)
RESULTS
Time evolution of systolic blood pressure
Control rats remained normotensive during the 3 weeks of treatment. SBP increased in the three exper imental groups from the second week onwards. The differences were statistically significant with respect to baseline and the C group values for the NaCl and Cl- diets (Table 1).
The NaCl group reached the highest SBP values in the second and third week, while the increases in the Cl and Na groups were lower than those reached in the NaCl group. As can be seen in Table 1, SBP in the Na group showed a lower elevation with respect to the other two experimental groups, but without reaching significant differences with respect to the C group.
Plasma and urinary parameters
Regarding serum creatinine, sodium, chloride, and plasma osmolarity (estimated from serum sodium, glucose, and urea), no significant differences were observed in any of the groups. Compared with the C group, urinary creatinine decreased in the other three groups, and urinary sodium increased in the high sodium diet groups (NaCl and Na) and decreased in the Cl- group. The urinary sodium/chloride index, which evaluates urinary equimolarity between the two ions, increased significantly in the Na group, and reached values very close to equimolarity in the Cl group (Table 2).
Diuresis increased in the three groups with respect to C, while CrCl decreased in the NaCl and Na groups. In the NaCl and Na groups, UENa, FENa, UECl and FECl increased compared with the C group (Table 2).
Compared with the NaCl group, an increase in UENa and a decrease in UECl were observed in the Na group. Similarly, in the Na group, FECl was lower than FENa.
The Cl group did not show significant differences with respect to the C group, but it did show significant differences compared with the NaCl and Na groups, with a lower urinary and fractional excretion of both ions (Table 1).
Table 1. Time evolution of systolic blood pressure and parameters of renal excretory functionality

Cl-: chloride; CrCl: creatinine clearance; FE: fractional excretion; UE:urinary excretion; Na :sodium; NaCl:sodium chloride
* p<0.05 vs. control; $ p<0.05 vs. NaCl; @ p<0.05 vs. FENa; Δ p<0.05 vs. Na; & p<0.05 vs. t=0; § p < 0.05 vs. 1st week.
Table 2. Plasma and urinary parameters

Cl: chloride; Na:sodium; NaCl: sodium chloride
* p<0.05 vs. control; $ p<0.05 vs. NaCl; Δ p<0.05 vs. Na.
Oxidative stress and inflammation markers in the renal cortex
TBARS increased in the renal cortex in the experimental groups compared with the C group (Figure 1 A). On the other hand, while GPx protein expression was not modified in any group, the activity of this enzyme increased in the NaCl and Cl groups with respect to C and Na groups (Figure 1 B).
Increased renal expression of p50-NFkB and AT1R was observed in the NaCl and Cl- groups compared with the other two groups (Figures 1C and D, respectively). The expression of AT2R was significantly reduced in the NaCl and Cl groups (Figure 1E). The expression of PARK7 was decreased in the Cl group compared with the C group (Figure 1F). Finally, while ClC-5 was significantly reduced in the NaCl group compared with the C group (Figure 2A), the NaCl and Cl groups showed higher expression of ClC-K1 (Figure 2B)
Histological characteristics of the renal parenchyma
Figure 3 shows representative microphotographs of the histological characteristics of the renal parenchy ma from the 4 experimental groups, using H-E technique. The qualitative histological analysis shows that the animals of the NaCl and Cl groups exhibited more pronounced tubulointerstitial changes characterized by tubular dilation compared with the C group. In addition, both groups also exhibited urinary space dilation with respect to the C group. Finally, the Na group evidenced the presence of less pronounced changes compared with the other two experimental groups.
DISCUSSION
Temporal evolution of systolic blood pressure
The results of this study suggest that NaCl overload is associated with HTN. Increased SBP is also related to chloride overload, since the Cl group attained pressure values over 140 mmHg, above the Na group. The Cl- anion is a NaCl component that could have a more specific role in salt-sensitivity, and that could be even more significant than Na+. (14) Other studies carried out in Dahl “salt-sensitive” rats demonstrated that, throughout several weeks, HTN developed in animals consuming NaCl, but not in those fed with sodium bicarbonate (NaHCO3) or other Na+ salts. (22-24)
On the other hand, the overeating of “non-sodium” chloride salts, that is accompanied by a lower urinary excretion of Cl- than that produced in the presence of Na+, could be related with a selective Cl- accumulation in the organism, leading to the development of “salt-sensitive” HTN. (25-27)
Fig 1. Oxidative stress and inflammation markers in the renal cortex. A) TBARS: Thiobarbituric acid reactive substances . B) GPx: Glutathione peroxidase. C) p50-NFkB: Nuclear factor kappa B; GAPDH: glyceraldehyde 3-phosphate dehydrogenase D) AT1R : Angiotensin II type I receptor E) AT2R: Angiotensin II type 2 receptor . F) PARK7: Parkinson disease protein 7.
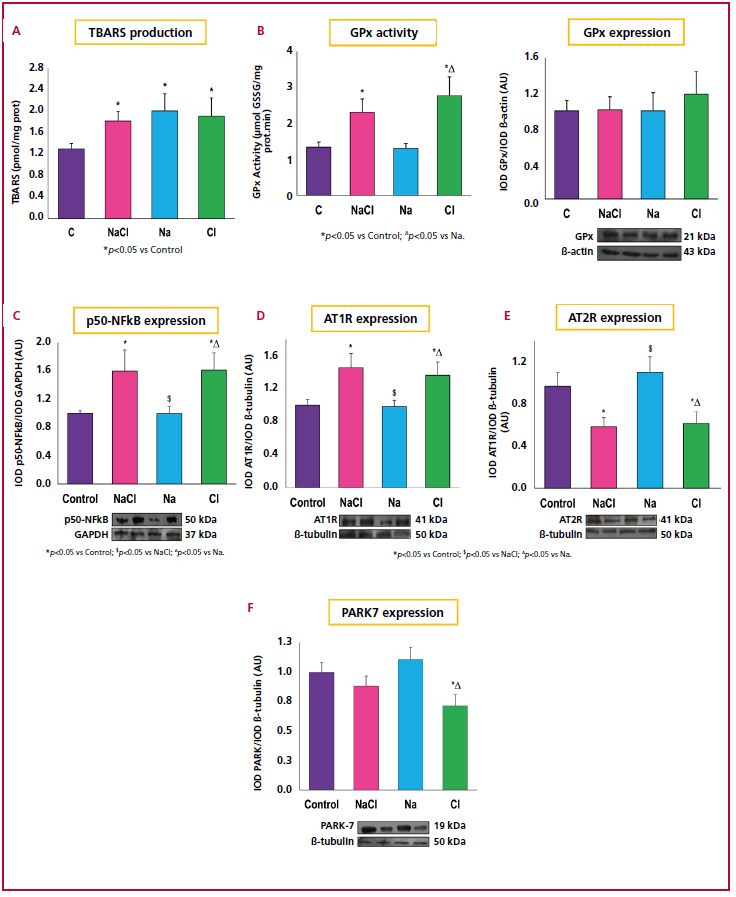
Cl: chloride; Na : sodium; NaCl: sodium chloride; AU: arbitrary units
* p<0.05 vs. Control; $ p<0.05 vs. NaCl; Δ p<0.05 vs. Na.
Fig 2. Renal expresión of ClC-5 and ClC-K1 chloride channels

Cl: chloride; Na: sodium; NaCl: sodium chloride
#p<0.0001 vs. Control; *p<0.05 vs. Control; $p<0.05 vs. NaCl; Δp<0.05 vs. Na; #p<0.001 vs. NaCl.
Plasma and urinary parameters
The absence of changes in the plasma concentrations of sodium and chloride and osmolarity are evidence of the biological efficiency of physiological mechanisms to compensate for a possible hypernatremia and/or hyperchloremia, and to preserve plasma osmolarity.
Natriuria and urinary chloride increased in the NaCl group with respect to the C group, and the Na+/ Cl- index was similar in both groups. In the Na group it is possible that the secretion and excretion of bicarbonate increases with respect to the other groups, a result consistent with the Na+/Cl- urinary index, suggesting that Cl- is not the main counterion of excreted Na+. The objective of HCO3- secretion is to compensate for the metabolic alkalosis in the animals receiving Na+ citrate and, as a consequence, Cl- reabsorption would be increased and its excretion decreased, since the Cl-/HCO3- exchanger would present greater expression in the apical membranes of the distal, convoluted, collector, cortical and connector tubule cells, independently of the Na+ cation. (14) The low urinary chloride in the Cl- group is striking compared with the control rats, suggesting that it is also necessary to eliminate Na+ as a counterion for its excretion.
These results indicate that the Cl- anion would be accumulating in some compartment, such as the skin, since its plasma levels continue to be normal. (26, 27)
Fig 3. Histological images representative of the renal parenchyma stained with H-E. Scale bar=50 μm. Red arrows indicate tubulointerstitial changes and black arrows urinary space dilation.

Cl: chloride; Na:sodium; NaCl: sodium chloride
Oxidative stress and inflammatory markers in the kidney
Na+, Cl- or both ions overload in the diet was associated with an increase of lipid peroxidation in the renal cortex, represented by increased TBARS production The prooxidant state in these cells is characterized by increased production of reactive oxygen species (ROS). Despite GPx protein expression was not affected, its activity was increased. Its regulation is related with post- translational modifications taking place in the active site of the enzyme, independently that its expression varies or not. (28)
Cl- can convert to hypochlorous acid (HOCl) in the presence of hydrogen peroxide (H2O2), a reaction catalyzed by the myeloperoxidase enzyme (MPO). (29) The reactions of oxidative damage to the biomolecules are predominantly associated in most cases with secondary reactive nitrogen species (RNS) as peroxynitrite (ONOO-) and HOCl. HOCl formation is also known to be associated with tissue damage. (30,31) On the other hand, ROS are known to contribute to the activation of proinflammatory signaling pathways such as NF-kB. (32) To study the participation of the Cl- anion in the renal inflammatory response, the expression of inflammatory markers such as p50-NFkB and AT1R was evaluated. (33-35) The present study showed that the levels of p50-NFkB and AT1R expression were significantly increased in the NaCl and Cl groups, which also suggest a proinflammatory state at the renal level compared with excess sodium.
On the other hand, it has been shown that PARK7, also called DJ-1 has antioxidant activity eliminating H2O2 and regulating the expression of several antioxidant enzymes, as superoxide dismutase (SOD). (36,37) Increased PARK7 levels were expected to increase. However, we have observed that their expression decreases in the Cl group compared with the C group. It has been demonstrated that AT1R interacts with PARK7, which could support the hypothesis that AT1R is negatively regulating it. (38) Nevertheless, further findings are still needed to elucidate this hypothesis.
ClC-5 and ClC-K1 chloride channels
The ClC-5 channel participates in the endosome acidification of kidney, intestine, and liver tissues. ClC-5 is mainly expressed in intracellular vesicles of the proximal tubule and plays a key role in exocytosis. (10) Endosomal acidification is principally achieved through the active transport of H+ by a vacuolar-type ATPase H+. Since the active transport of H+ is electrogenic, it requires the concurrent movement of chloride anions towards the endosomal compartments. (39) In vitro studies have recently shown that high NaCl concentrations decrease its levels of expression. (16) Currently, however, the involved specific mechanisms are unknown. Our results confirm that in excess NaCl reduces ClC-5 expression in the renal cortex compared with the C group, but not in the Cl and Na groups, suggesting an important role in the reabsorption of both ions in the renal proximal tubule. (40) The mechanism by which Cl- and Na+ jointly reduce the expression of ClC-5 in the renal cortex is as yet unknown.
The ClC-K1 channel participates in the epithelial transport of chloride in the kidney and in the mechanisms of urinary concentration. (12) It is known that high concentrations of NaCl are associated with an increased expression of ClC-K1 in the ascending thin limb of Henle's loop, (17) but the effects of a diet rich in chlorides on the expression of this channel is unknown. Our results indicate that the NaCl and Cl groups present a higher renal expression of ClC-K1.
These findings suggest that the ClC-K1 channel has an important role in maintaining the homeostasis of the chloride anion and water by promoting its excretion.
CONCLUSION
Taken together, these results support the hypothesis that the Cl- anion together with the Na+ cation would be co-responsible for triggering renal oxidative damage and increasing blood pressure. Therefore, further studies are necessary to test the importance of reducing the intake of both anions as a preventive non-pharmacological measure to avoid and control HTN. Our results put in evidence the participation of ClC-K1 and ClC-5 channels as mediators of this process.
Conflicts of interest
None declared.
(See conflicts of interest forms on the website).
Funding
Part of the study was funded by the following grants: PICT 2021-I-A-00607 and PIP CONICET 2022-2024.
https://creativecommons.org/licenses/by-nc-sa/4.0/

©Revista Argentina de Cardiología
REFERENCES
- Kurtz, T. W., Al-Bander, H. A., & Morris Jr, R. C. (1987). Salt-sensitive essential hypertension in men. New England Journal of Medicine, 317(17), 1043-1048.
- Luft FC, Zemel MB, Sowers JA, Fineberg NS, Weinberger MH. Sodium bicarbonate and sodium chloride: effects on blood pressure and electrolyte homeostasis in normal and hypertensive man. J Hypertens. 1990;8:663-70. https://doi.org/10.1097/00004872-199007000-00010
- Shore, A. C., Markandu, N. D., & MacGregor, G. A. (1988). A randomized crossover study to compare the blood pressure response to sodium loading with and without chloride in patients with essential hypertension. Journal of hypertension, 6(8), 613-617.
- Berghoff, R. S., & Geraci, A. S. The influence of sodium chloride on blood pressure. IMJ. 1929;56:395-7.
- Iqbal, S., Klammer, N., & Ekmekcioglu, C. (2019). The effect of electrolytes on blood pressure: a brief summary of meta-analyses. Nutrients, 11(6), 1362.
- van der Leeuw J, de Borst MH, Kieneker LM, Bakker SJL, Gansevoort RT, Rookmaaker MB. Separating the effects of 24-hour urinary chloride and sodium excretion on blood pressure and risk of hypertension: Results from PREVEND. PLoS One. 2020;15:e0228490. https://doi.org/10.1371/journal.pone.0228490
- Zanfirescu, A., Ungurianu, A., Tsatsakis, A. M., Nițulescu, G. M., Kouretas, D., Veskoukis, A., & Margină, D. (2019). A review of the alleged health hazards of monosodium glutamate. Comprehensive reviews in food science and food safety, 18(4), 1111-1134.
- Barlassina C, Dal Fiume C, Lanzani C, Manunta P, Guffanti G, Ruello A, et al. Common genetic variants and haplotypes in renal CLCNKA gene are associated to salt-sensitive hypertension. Hum Mol Genet. 2007;16:1630-8. https://doi.org/10.1093/hmg/ddm112
- Berend K, van Hulsteijn LH, Gans RO. Chloride: the queen of electrolytes? Eur J Intern Med. 2012;23:203-11. https://doi.org/10.1016/j.ejim.2011.11.013
- Devuyst O, Guggino WB. Chloride channels in the kidney: lessons learned from knockout animals. Am J Physiol Renal Physiol. 2002;283:F1176-91. https://doi.org/10.1152/ajprenal.00184.2002
- Duan DD. The ClC-3 chloride channels in cardiovascular disease. Acta Pharmacol Sin. 2011;32:675-84. https://doi.org/10.1038/aps.2011.30
- Gerbino A, De Zio R, Russo D, Milella L, Milano S, Procino G, et al. Role of PKC in the Regulation of the Human Kidney Chloride Channel ClC-Ka. Sci Rep. 2020;10:10268. https://doi.org/10.1038/s41598-020-67219-8
- Kouyoumdzian, N. M., Kim, G., Rudi, M. J., Rukavina Mikusic, N. L., Fernández, B. E., & Choi, M. R. (2022). Clues and new evidences in arterial hypertension: unmasking the role of the chloride anion. Pflügers Archiv-European Journal of Physiology, 474(1), 155-176.
- McCallum L, Lip S, Padmanabhan S. The hidden hand of chloride in hypertension. Pflugers Arch. 2015;467:595-603. https;://doi.org/10.1007/s00424-015-1690-8
- Jentsch, T. J., Stein, V., Weinreich, F., & Zdebik, A. A. (2002). Molecular structure and physiological function of chloride channels. Physiological reviews, 82(2), 503-568.
- Mo S, Cui Y, Sun K, Wang H, Peng X, Ou L, et al. High sodium chloride affects BMP-7 and 1α-hydroxylase levels through NCC and CLC-5 in NRK-52E cells. Ecotoxicol Environ Saf. 2021;225:112762. https://doi.org/10.1016/j.ecoenv.2021.112762
- Bergler T, Stoelcker B, Jeblick R, Reinhold SW, Wolf K, Riegger GA, et al. High osmolality induces the kidney-specific chloride channel CLC-K1 by a serum and glucocorticoid-inducible kinase 1 MAPK pathway. Kidney Int. 2008;74:1170-7. https://doi.org/10.1038/ki.2008.312
- Lowry OH, Rosebrough NJ, Farr AL, Randall RJ. Protein measurement with the Folin phenol reagent. J Biol Chem. 1951;193:265-75.
- Fraga CG, Leibovitz BE, Tappel AL. Halogenated compounds as inducers of lipid peroxidation in tissue slices. Free Radic Biol Med. 1987;3:119-23. https://doi.org/10.1016/s0891-5849(87)80006-0
- Flohé L, Günzler WA. Assays of glutathione peroxidase. Methods Enzymol. 1984;105:114-21. https://doi.org/10.1016/s0076-6879(84)05015-1
- Guide for the Care and Use of Laboratory Animals, 8th edition. https://www.ncbi.nlm.nih.gov/books/NBK54050/
- Abboud HE, Luke RG, Galla JH, Kotchen TA. Stimulation of renin by acute selective chloride depletion in the rat. Circ Res. 1979;44:815- 21. https://doi.org/10.1161/01.res.44.6.815
- Kotchen TA, Galla JH, Luke RG. Failure of NaHCO3 and KHCO3 to inhibit renin in the rat. Am J Physiol. 1976;231:1050-6. https:// doi: 10.1152/ajplegacy.1976.231.4.1050
- Kotchen TA, Luke RG, Ott CE, Galla JH, Whitescarver S. Effect of chloride on renin and blood pressure responses to sodium chloride. Ann Intern Med. 1983;98:817-22. https://doi.org/10.7326/0003-4819-98-5-817
- Machnik A, Neuhofer W, Jantsch J, Dahlmann A, Tammela T, Machura K, et al. Macrophages regulate salt-dependent volume and blood pressure by a vascular endothelial growth factor-C-dependent buffering mechanism. Nat Med. 2009;15:545-52. https://doi.org/10.1038/nm.1960
- Machnik A, Dahlmann A, Kopp C, Goss J, Wagner H, van Rooijen N, et al. Mononuclear phagocyte system depletion blocks interstitial tonicity-responsive enhancer binding protein/vascular endothelial growth factor C expression and induces salt-sensitive hypertension in rats. Hypertension. 2010;55:755-61. https://doi.org/10.1161/HYPERTENSIONAHA.109.143339
- Matsuda JJ, Filali MS, Moreland JG, Miller FJ, Lamb FS. Activation of swelling-activated chloride current by tumor necrosis factor-alpha requires ClC-3-dependent endosomal reactive oxygen production. J Biol Chem. 2010;285:22864-73. https://doi.org/10.1074/jbc.M109.099838
- Cao C, Leng Y, Huang W, Liu X, Kufe D. Glutathione peroxidase 1 is regulated by the c-Abl and Arg tyrosine kinases. J Biol Chem. 2003;278:39609-14. https://doi.org/10.1074/jbc.M305770200
- Kato, Y. (2016). Neutrophil myeloperoxidase and its substrates: formation of specific markers and reactive compounds during inflammation. Journal of clinical biochemistry and nutrition, 58(2), 99-104.
- Liguori I, Russo G, Curcio F, Bulli G, Aran L, Della-Morte D, Gargiulo G, Testa G, Cacciatore F, Bonaduce D, Abete P. (2018). Oxidative stress, aging, and diseases. Clin Interv Aging 13:757–772. doi: 10.2147/CIA.S158513
- Weidinger A, Kozlov AV (2015) Biological Activities of Reactive Oxygen and Nitrogen Species: Oxidative Stress versus Signal Transduction. Biomolecules 5:472–484. doi: 10.3390/biom5020472
- Miller Jr, F. J., Filali, M., Huss, G. J., Stanic, B., Chamseddine, A., Barna, T. J., & Lamb, F. S. (2007). Cytokine activation of nuclear factor κB in vascular smooth muscle cells requires signaling endosomes containing Nox1 and ClC-3. Circulation research, 101(7), 663-671.
- Manrique C, Lastra G, Gardner M, Sowers JR. The renin angiotensin aldosterone system in hypertension: roles of insulin resistance and oxidative stress. Med Clin North Am. 2009;93:569-82. https://doi.org/10.1016/j.mcna.2009.02.014
- Sanz AB, Sanchez-Niño MD, Ramos AM, Moreno JA, Santamaria B, Ruiz-Ortega M, et al. NF-kappaB in renal inflammation. J Am Soc Nephrol. 2010;21:1254-62. https://doi.org/10.1681/ASN.2010020218
- Zhang H, Sun SC. NF-κB in inflammation and renal diseases. Cell Biosci. 2015;5:63. https://doi.org/10.1186/s13578-015-0056-4
- Cuevas S, Zhang Y, Yang Y, Escano C, Asico L, Jones JE, et al. Role of renal DJ-1 in the pathogenesis of hypertension associated with increased reactive oxygen species production. Hypertension. 2012;59:446-52. https://doi.org/10.1161/HYPERTENSIONAHA.111.185744
- Cuevas S, Villar VA, Jose PA, Armando I. Renal dopamine receptors, oxidative stress, and hypertension. Int J Mol Sci. 2013;14:17553-72. https://doi.org/10.3390/ijms140917553
- Lu Y, Zhang J, Han B, Yu Y, Zhao W, Wu T, et al. Extracellular vesicles DJ-1 derived from hypoxia-conditioned hMSCs alleviate cardiac hypertrophy by suppressing mitochondria dysfunction and preventing ATRAP degradation. Pharmacol Res. 2023;187:106607. https://doi.org/10.1016/j.phrs.2022.106607
- George AL Jr. Chloride channels and endocytosis: ClC-5 makes a dent. Proc Natl Acad Sci U S A. 1998;95:7843-5. https://doi.org/10.1073/pnas.95.14.7843
- Briet M, Vargas-Poussou R, Lourdel S, Houillier P, Blanchard A. How Bartter’s and Gitelman’s syndromes, and Dent’s disease have provided important insights into the function of three renal chloride channels: ClC-Ka/b and ClC-5. Nephron Physiol. 2006;103:p7-13. https://doi.org/10.1159/000090218