
INTRODUCTION
The worldwide consumption of diets rich in carbohydrates and fats is a key factor in the development of metabolic syndrome (MS), defined by the concurrence of at least three metabolic disorders- hyperglycemia, hypertriglyceridemia, insulin resistance, hypertension (HTN), systemic inflammation, or increased waist circumference - that damage various organs, particularly the kidneys, which are essential for electrolyte homeostasis and blood pressure control. (1,2) High- caloric diets induce structural and functional renal dysfunction and increase the risk of HTN, a chronic and asymptomatic disease responsible for approximately 50% of global cardiovascular mortality. (3,4) According to a 2021 World Health Organization population study published in The Lancet, including 104 million participants, the prevalence of HTN was 59% in women (aged 55-62) and 49% in men (aged 46-52), with only 47% and 38% respectively, receiving treatment. (5) More recently, in 2023, the WHO report "Global Report on Hypertension: The Race Against a Silent Killer" noted a global prevalence of 34% in men and 32% in women, a difference that tends to disappear with advancing age. (6). In Argentina, the RENATA 2 study (2017) reported an incidence of 36.3% in adults aged 26-60 years, higher in men. (7)
The renal dopaminergic system (RDS) and the renin- angiotensin system (RAS) play a key role in the renal regulation of blood pressure. The RDS, located in the proximal convoluted tubule, promotes natriuresis, diuresis, and anti- inflammatory effects by acting on D1 and D2 receptors, counteracting the action of insulin and angiotensin II (Ang II). (8) Conversely, overactivation of the RAS stimulates tubular reabsorption of sodium and water and increases inflammation and oxidative stress. Both systems maintain functional antagonism, as angiotensin II inhibits dopaminergic synthesis and activity. (9) In this context, the L- dopa/dopamine ratio has been proposed as an early biomarker of renal damage in animal models of fructose- induced HTN. (10)
Pharmacological treatment of HTN includes AT1 receptor (AT1R) antagonists, including losartan (L), a potent and selective competitive blocker that specifically inhibits the effects of Ang II. (11) Although its antihypertensive efficacy is well known, its ability to modulate the RDS- RAS balance in MS induced by high- fat diets (HFD), as part of its nephroprotective action, has not been fully clarified. In this context, we proposed to evaluate whether a HFD alters this balance as a mechanism of HTN and whether early treatment with L prevents these alterations in an experimental model of MS induced by HFD for 8 weeks. The usefulness of the L- dopa/dopamine index as an early biomarker of renal dysfunction was also analyzed.
METHODS
A) Animals, experimental design, and diet.
Male Sprague- Dawley rats (6 weeks old, 180-200 g; Central Animal Facility, FFyB- UBA) were kept under controlled conditions (22±2°C, 50-70% humidity, 12h light/dark) and studied for 8 weeks. The animals were divided into four groups (n=4-6):
- C: standard diet (SD) and water ad libitum (Asociación Cooperativas Argentinas; 20% protein, 3% fat, 2% fiber, 6% minerals, 69% starch, vitamins; 3.3 kcal/g);
- HFD: SD + 50% w/w fat and water ad libitum (Faty, Quick-food S.A., Argentina; 9 kcal/g, 99% total fat, 77% saturated, 19% trans);
- CL: C + losartan (L), 30 mg/kg/day, water. (Losartan po-tassium, 100% dry basis, Droguería Saporiti S.A.C.I.F.I.A, Buenos Aires, Argentina);
- HFDL: HFD + CL.
B) Body weight, food consumption, and calories.
Body weight was recorded daily. Food and drink intake was measured every 48 hours. Calculation included: I) food (g/day) = offered - remaining; II) drink (mL/day) = offered - remaining; III) calories: C and CL = SD (g) × 3.3 kcal/g; HFD and HFDL = SD (g) × 3.3 kcal/g + fat (g) × 9 kcal/g.
C) Systolic blood pressure (SBP).
This was measured at the start and before sacrifice using tail plethysmography with a photoelectric sphygmomanometer (Grass D.C. 7DAC) and oscilloscope (Grass D.C. 79D, Grass Instruments Co., USA).
D) Urine and blood collection.
Three days before sacrifice, the animals were housed in metabolic cages for 48 hours. Urine collection: I) the urinary fraction from the first 6 hours was recovered in an aqueous solution of hydrochloric acid with a 6N concentration (HCl 6N), aliquoted in HCl 1N and stored at -80°C for L-dopa and dopamine assessed by high- performance liquid chromatography (HPLC); II) The urinary fraction from the following 18 hours was stored at -20°C for sodium, creatinine, and albumin assessment (Spectrum CCX, Abbott Diagnostics, USA). Diuresis was measured by total volume urinated in 24 h. On the sacrifice day, after 6- h fasting, blood was obtained by retro- orbital puncture under anesthesia (ketamine 80 mg/kg + xylazine 12 mg/kg, PRO- SER SA).
E) Tissue collection.
The animals were sacrificed under anesthesia in a CO2 chamber. The kidneys were decapsulated, weighed, and randomly distributed for histology, transmission electron microscopy (TEM), and Western blot.
F) Assessments.
F-1) Plasma metabolism: Blood glucose was assessed with Accu- Chek Performa Nano (Roche Diagnostics, Germany), triglyceridemia with TG Color GPO/PAP AA kit (Wiener Lab., Argentina) and insulin by ELISA test (Mercodia Rat Insulin ELISA, Sweden). The triglyceride- glucose product (TyG) (12) and the Homeostatic Model Assessment of Insulin Resistance (HOMA- IR) index were calculated. (13)
F-2) Renal function: Sodium and creatinine were measured in plasma and urine (Spectrum CCX), glomerular filtration rate (GFR) was estimated by creatinine clearance and tubular function was assessed by urinary sodium excretion (UNa+V) and fractional excretion of sodium (FENa).
F-3) Urinary catecholamines: L- dopa and dopamine were measured by reverse- phase HPLC (Zorbax RxC18 column; DuPont, USA; amperometric detection, ESA, USA). Internal standard: 3,4- dihydroxybenzylamine (Sigma- Aldrich, Cat. No. 858781). External standards were: L- dopa (Cat. No. 13248) and dopamine (Cat. No. 21992), both from Cayman Chemical. The detection limit was 20 pg/sample.
F-4) Albuminuria: It was measured with Cobas equipment (ALBT2 Tina- quant Albumin Gen.2; Roche Diagnostics, Switzerland); The urinary albumin/creatinine ratio was determined, considering microalbuminuria between 30-300 mg/g. (14)
F-5) Renal protein expression of the amino acid and thyroid hormone transporter LAT2, membrane transport proteins OCT2 and OCTN1,2,3, dopaminergic receptors D1R and D2R, Ang II receptor AT1R, sodium- potassium ATPase (Na+K+ATPase), transforming growth factor beta 1 (TGFbeta1), and nuclear factor kappa B1 (NFkB1) were assessed by Western blot. Beta- tubulin was used for load control and optical densitometry (ImageJ) for analysis. Because several of the antibodies have similar molecular weights, the membrane stripping technique with 5% acetic acid was used after the primary antibody was developed in order to mark the expression of the load control. (Table 1)
F-6) Renal histology: 8- micron thick sections were stained with hematoxylin- eosin and Sirius Red (15). Cortical fibrosis was quantified in 20 fields/animal (ImageJ) using a Nikon Type 104c microscope to obtain the images. Cortical fibrosis is expressed as: fibrosis percentage (%) = [Σ cortical interstitial collagen / (Total area - Σ vessels)] × 100.
F-7) Renal ultrastructure; 1 mm3 renal cortical fragments were used for TEM and observed with a Zeiss EM 109T TEM with Gatan ES1000W digital camera.
Table 1
Primary antibodies used for Western blot.
| Protein | Antibody | Dilution | Molecular weight | Supplier and catalog number |
|---|---|---|---|---|
| D1R | Rabbit polyclonal anti-D1R | 1:1000 | 50 kDa | Proteintech, catalog number 17934-1-AP |
| D2R | Rabbit polyclonal anti-D2R | 1:600 | 51 kDa | Proteintech, catalog number 55084-1-AP |
| OCTN 1,2,3 | Rabbit polyclonal anti-OCTN 1,2,3 | 1:2000 | 90 kDa | Santa Cruz Biotechnology, Inc., catalog number sc-33534 |
| OCT2 | Goat polyclonal anti-OCT2 | 1:800 | 50 kDa | Santa Cruz Biotechnology, Inc., catalog number sc-19814 |
| LAT2 | Goat polyclonal anti-LAT2 | 1:800 | 50 kDa | Santa Cruz Biotechnology, Inc., catalog number sc-27581 |
| AT1R | Rabbit polyclonal anti-AT1R | 1:1000 | 50 kDa | Proteintech, catalog number 25343-1-AP |
| Na+K+ATPase | Rabbit polyclonal anti-alpha-1 Na+K+ATPase | 1:10,000 | 105 kDa | Abcam, catalog number ab74945 |
| NFkB1 | Rabbit polyclonal anti-NFkB1 | 1:1000 | 50 kDa and 105 kDa | Proteintech, catalog number 14220-1-AP |
| TGF-beta1 | Rabbit polyclonal anti-TGF-beta1 | 1:500 | 44 kDa | Proteintech, catalog number 21898-1-AP |
| Beta-tubulin | Rabbit polyclonal anti-beta-tubulin | 1:3000 | 50 kDa | Abcam, catalog number ab6046 |
Statistical analysis
InfoStat statistical package was used for Student's t- test, one- way ANOVA with Tukey post- hoc test, and Pearson and linear regression correlations. Results were expressed as mean ± standard error of the mean (SEM) and significance was p<0.05. GraphPad Prism v10.2.3 was used for graphs.
Ethical considerationss
Procedures were approved by CICUAL- UBA (Res. CD No. 1881/1999, director Dr. M. R. Choi), in accordance with international ethical standards in animal experimentation.
RESULTS
Table 2 shows that HFD induced a significant increase in body weight compared with C, which was prevented by L in HFDL. Food intake decreased in HFD versus C, an effect reversed by L, while calorie intake increased in HFD with no differences between HFD and HFDL. Water intake did not vary between groups. Plasma parameters showed significant increases in HFD compared with C, with reductions in triglycerides and insulin in HFDL; TyG index and HOMA- IR did not differ between groups.
Table 2
Body weight, food, water, and calorie intake and plasma metabolic parameters.
| Parameter | C | HFD | CL | HFDL |
|---|---|---|---|---|
| Body weight (g) | 415.7±8.7 | 473.8±14.1* | 389.7±3.8 | 359.13±7.93§ |
| Food intake (g/24 hours) | 20.9±3.6 | 13.8±1.3† | 28.4±3.5 | 18.6±1.7‡ |
| Water intake (mL/24 hours) | 12.5±3.9 | 12.4±0.7 | 20.5±2.7 | 19.1±1.3 |
| Calorie intake (kcal/24 hours) | 60.5±10.8 | 103.6±11.5* | 72.4±11.4 | 119.3±11.1 |
| Triglycerides (mg/dL) | 59.68±6.13 | 119.25±4.17† | 53.20±4.41 | 82.97±6.93‡ |
| Blood glucose (mg/dL) | 117.5±7.5 | 152.2±4.6† | 100.3±29.6 | 173.7±14.0‡ |
| TyG index | 8.0±0.2 | 10.5±0.1† | 8.1±0.3 | 10.2±0.2 |
| Insulin (ng/mL) | 1.20±0.10 | 4.20±0.50† | 1.3±0.2 | 2.8±0.4‡ |
| HOMA-IR | 0.7±0.1 | 3.3±0.5† | 1.5±0.7 | 3.2±0.5 |
Results are expressed as mean ± SEM. Significance is considered as *p<0.05 C vs. HFD; †p<0.01 C vs. HFD; ‡p<0.05 HFDL vs. HFD; §p<0.01 HFDL vs. HFD. C: standard diet and water ad libitum (SD); CL: C + losartan (L); HFD: SD + 50% w/w fat and ad libitum water; HFDL: HFD + CL; HOMA-IR: Homeostatic Model Assessment of Insulin Resistance; SEM: standard error of the mean; TYG: triglyceride-glucose product.
Table 3 shows how HFD increased SBP and the urinary L- dopa/dopamine index compared with C, effects attenuated by L in HFDL. The CL group showed an additional reduction in SBP compared with C. No changes were observed in the urinary albumin/creatinine ratio or GFR. Diuresis, FENa+, and UNa+V decreased in HFD and were prevented by L in HFDL.
Table 3
Systolic blood pressure, urinary L-dopa/dopamine index and plasma and urinary parameters of renal function.
| Parameter | C | HFD | CL | HFDL |
|---|---|---|---|---|
| SBP (mmHg) | 120.7±2.3 | 134.8±2.3† | 106.4±2.5¶ | 109.5±2.0§ |
| L-dopa/dopamine index | 1.1±0.1 | 2.9±0.2† | 1.8±0.1 | 1.8±0.1§ |
| Albumin/urinary creatinine (mg/g) | 17.42±1.98 | 12.93±0.66 | 15.31±1.52 | 8.45±1.13 |
| Diuresis (mL/24 hours) | 16.4±2.2 | 3.5±0.3† | 17.28±1.38 | 6.23±0.93‡ |
| GFR (mL/min) | 1.65±0.27 | 1.38±0.11 | 1.77±0.20 | 1.42±0.09 |
| FENa (%) | 0.50±0.06 | 0.16±0.02† | 0.51±0.02 | 0.32±0.05‡ |
| UNa+V (mEq/24 hours) | 1.78±0.18 | 0.45±0.05† | 1.95±0.01 | 0.78±0.10‡ |
Results are expressed as mean ± SEM. Significance is considered as: *p<0.05 C vs. HFD; †p<0.01 C vs. HFD; ‡p<0.05 HFD vs. HFDL; §p<0.01 HFD vs. HFDL; ¶p<0.01 CL vs. C; GFR: glomerular filtration rate; FENa: fractional excretion of sodium; SBP: systolic blood pressure; SEM: standard error of the mean; UNa+V: urinary sodium excretion.
Hematoxylin- eosin staining showed cytoplasmic vacuoles in cortical tubular cells in HFD versus C, with no alterations in CL compared with C. Fewer vacuoles were present in HFDL than in HFD (Figure 1 A- D). The podocyte ultrastructure revealed shortening and fusion of pedicles in HFD, which was prevented by L in HFDL, and with no difference between CL and C (Figure 1 E to H).
Figure 1.
Structure and ultrastructure of the renal cortex
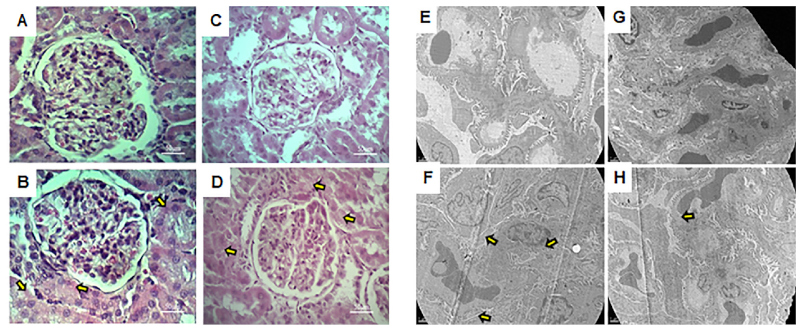
A, B, C, and D photos: Optical microscopy with hematoxylin and eosin staining, total magnification:400X E, F, G, and H photos: Transmission electron microscopy, total magnification: 7000X. Nomenclature: A-E: C group. B-F: HFD group. C-G: CL group. D-H: HFDL group. In A, B, C, and D, the yellow arrows point to the cytoplasmic vacuoles of the tubular cells. In E, F, G, and H, the yellow arrows point to the podocyte pedicles with altered morphology.
HFD overexpressed AT1R and reduced the membrane transport protein OCTN1,2,3, compared with C, while L prevented this decrease. L also prevented the overexpression of the D1R dopaminergic receptor in HFDL compared with HFD and D2R, which was decreased in HFD and was not modified by L. LAT2 and OCT2 did not vary between groups. Na+K+ATPase was increased in HFD, but L returned it to normal values in HFDL compared with HFD (Figure 2).
Figure 2.
RDS, RAS, and Na+K+ATPase protein expression in the renal cortex by Western blot
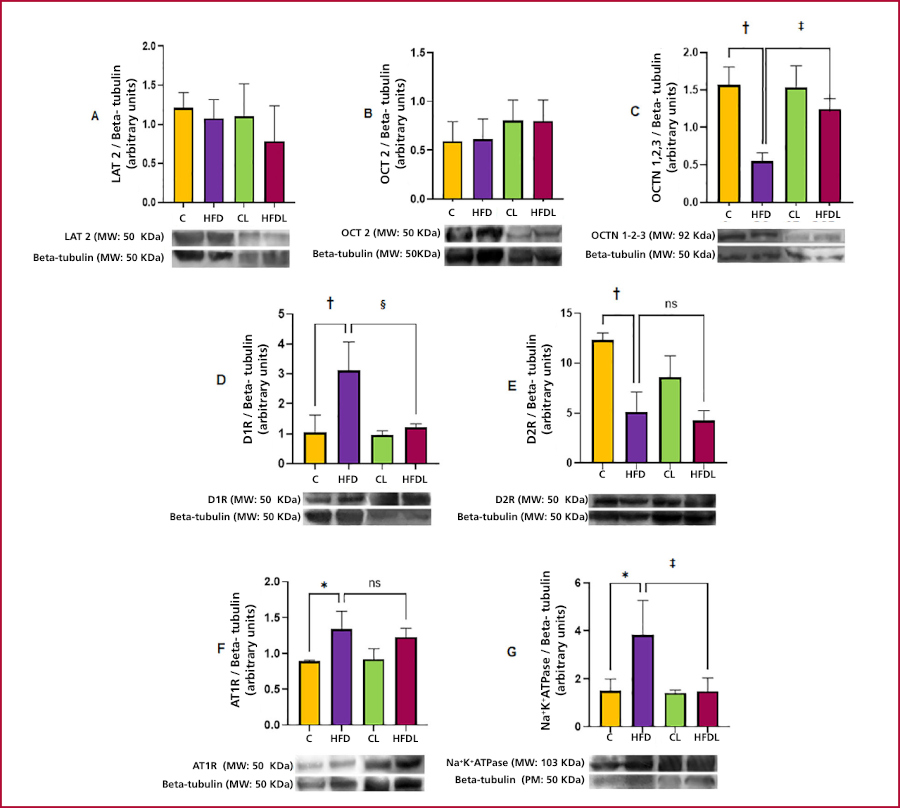
A: LAT2. B: OCT2. C: OCTN 1,2,3. D: D1R. E: D2R. F: AT1R. G: Na+K+ATPase. Results are expressed as mean ± SEM. Significance is considered as: *p<0.05 C vs. HFD; †p<0.01 C vs HFD; ‡p<0.05 HFDL vs HFD; §p<0.01 HFDL vs HFD.
C: standard diet and water ad libitum (SD); CL: C + losartan (L); HFD: SD + 50% w/w fat and ad libitum water; HFDL: HFD + CL; RAS: renin angiotensin system; RDS: renal dopaminergic system; SEM: standard error of the media. Remaining abbreviations in the text
The L- dopa/dopamine index correlated positively with SBP, insulinemia, and D1R, and inversely with UNa+V and OCTN1,2,3. Losartan prevented these alterations in HFDL compared with HFD (Figure 3).
Figure 3.
Functional correlations with the L-dopa/dopamine index
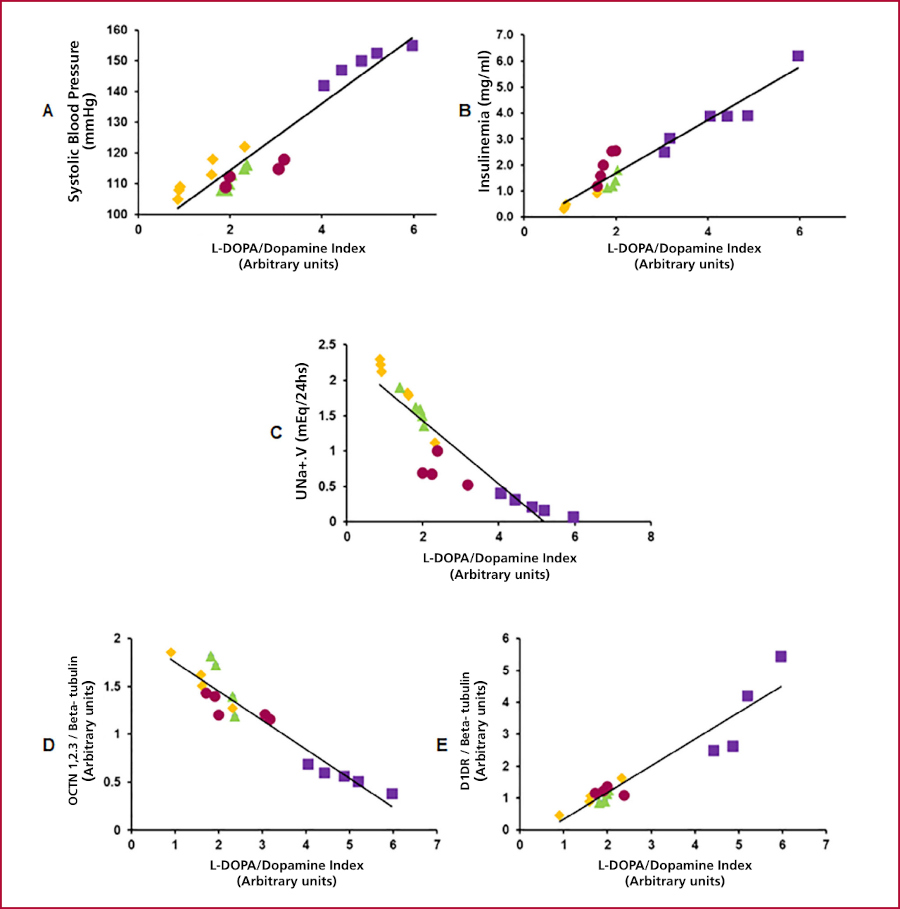
A: Linear regression SBP versus L-dopa/DA index; r = 0.95, R2 = 0.90, p<0.01; B: Linear regression of insulinemia versus L-dopa/DA index; r = 0.96, R2 = 0.91, p<0.01; C: Linear regression of UNa+ versus L-dopa/DA index; r = 0.91, R2 = 0.83, p<0.01; D: Linear regression of OCTN 1,2,3 versus L-dopa/ dopamine index; r = 0.95, R2 = 0.91, *p<0.01 and E: Linear regression of D1R versus L-dopa/dopamine index; r = 0.95, R2 = 0.89, *p<0.05. Group and color codes: C: Yellow. HFD: Violet. CL: Green. HFDL: Burgundy.
HFD significantly increased the expression of NFkB1 and TGF- beta1, effects that were prevented by L in HFDL. Interstitial fibrosis increased in HFD compared with C, and L significantly prevented this in HFDL compared with HFD, with residual foci and no changes in CL compared with C. Semi- quantitative analysis confirmed these findings (Figure 4).
Figure 4.
Evaluation of inflammation markers in the renal cortex by Western blot and fibrosis percentage by histology with Sirius red staining.
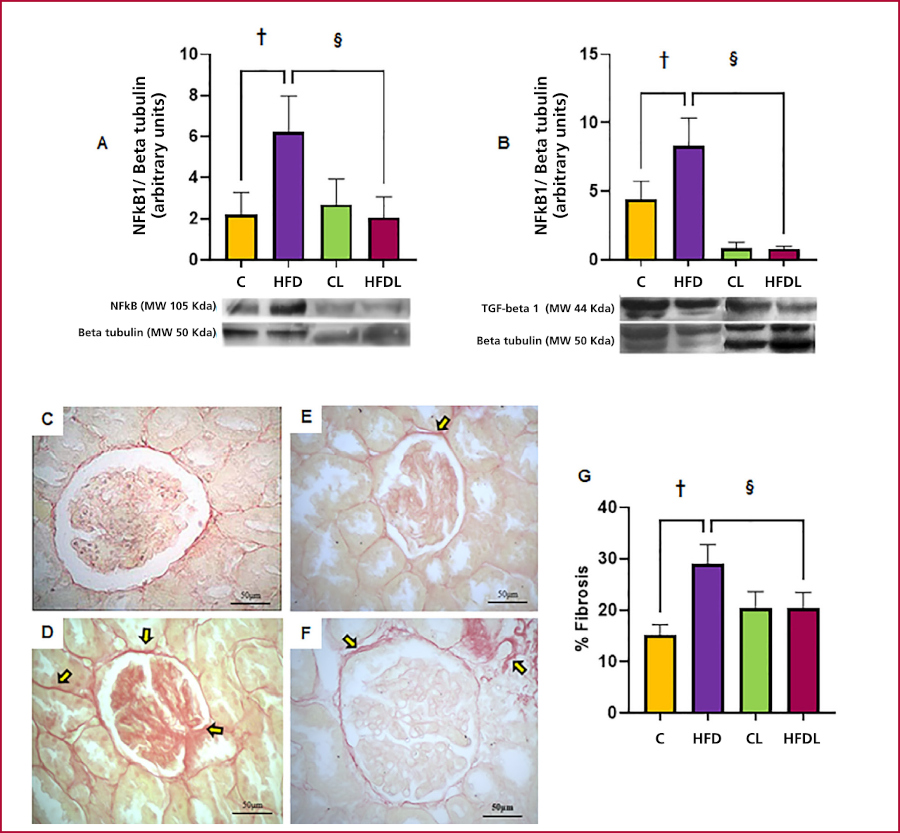
A: NFkB1. B: TGF-beta1. Photo C: C group. Photo D: HFD group. Photo E: CL group. Photo F: HFDL group. Graphic G: fibrosis percentage. The yellow arrows point to sites of increased interstitial fibrosis. Total magnification: 400X Results are expressed as mean ± SEM. Significance is expressed as: †p<0.01 C vs. HFD; §p<0.01 HFDL vs. HFD.
DISCUSSION
High fat diet consumption significantly increased body weight compared with C, an effect that was prevented by L. Although food intake was lower in HFD, the caloric density of the diet resulted in 33% more calories consumed, which explains the increase in body weight, in agreement with findings reported by Pinhal et al. (16) Our results coincide with Smith et al.,(17) who described a reducing effect of L on body weight, suggesting a regulating role of AT1 antagonism in HFD-induced obesity. Moreover, Hosseini et al. (18) suggested that L may improve leptin resistance and modulate body weight in conditions of diet-induced obesity. Water intake did not differ between groups, and the previously validated L administration in drinking water (19) avoided the bias associated with chronic gavage (force-feeding).
The metabolic profile showed insulin resistance in HFD versus C, with increased triglycerides, blood glucose, insulin, TyG, and HOMA-IR, consistent with previous reports in HFD-induced MS models. (18) Losartan partially attenuated triglycerides and insulin without modifying blood glucose or indices, while CL did not differ from C. These findings are consistent with the literature regarding metabolic alterations caused by HFD and the beneficial effects of L, which could be due to the reduction of oxidative stress via the activation of superoxide dismutase (SOD), although the precise mechanism remains unclear. (17,20)
HFD significantly increased SBP compared with C, in agreement with findings of Jin et al. and Li et al. (21,22), who demonstrated that HFD induces obesity, insulin resistance, and hyperinsulinemia, accompanied by RAS activation, increased Ang II, aldosterone, and AT1R expression, along with inflammation and renal fibrosis. In our model, concomitant administration of L prevented the increase in SBP in HFDL compared with HFD, an effect attributable to its antagonistic action on AT1R. (16) In addition, L significantly reduced SBP in normotensive controls (CL), in line with findings reported by Lee et al. (19) Li et al. (22) described an allosteric effect of L on AT1R, which potentiates D1R activity, contributing to its antihypertensive action.
Glomerular filtration rate showed no differences between groups. Similar results were reported by Roza et al. (23) in mice treated with HFD at 8 and 12 weeks. In addition, other groups reported increased levels associated with glomerular hyperfiltration in obese animals. (24,25) These findings suggest that the effect of HFD on GFR is variable. Treatment with L also did not modify this parameter between the groups evaluated.
The urinary albumin/creatinine ratio, which is more reliable than the absolute values of the metabolites separately, did not exceed 30 mg/g in any group, ruling out microalbuminuria. L did not modify this marker, suggesting that the alterations derive from the diet and not from the drug. In contrast, Sánchez-Navarro et al. (26) reported a significant increase of GFR under longer- term HFD, indicating that exposure time could be a determining factor.
HFD reduced diuresis versus C as reported by Sánchez-Navarro et al. (26), possibly due to lower RDS activity and higher RAS activity. (10) L prevented this reduction in HFDL, suggesting restitution of RDS function by AT1R blockade. (22) Similarly, FENa+ and UNa+V were reduced in HFD, partially prevented by L in HFDL, although without reaching CL values, indicating the possible involvement of sodium reabsorption mechanisms independent of Na+K+ATPase such as the Na+/H+ exchanger or the epithelial sodium channel (ENaC). (27,28) Previous results show disparity: Roza et al. (23) observed no changes, while Pinhal et al. (16) reported decreased FENa+ and UNa+V in obesity or prolonged HFD. HFD is thus associated with the observed alterations, and L exerts a partial preventive effect.
Histologically, HFD induced cytoplasmic vacuoles in the proximal convoluted tubule (PCT), which was absent in C and partially prevented by L in HFDL, with no changes in CL. Although lipid stains were negative, the literature suggests that they could correspond to lipid vacuoles (4,29) or hydropic degeneration due to Na+K+ATPase dysfunction associated with lipotoxicity (30), and attenuated by L through reduction of inflammation and oxidative stress. (19) Ultrastructural analysis with TEM showed obliteration and interdigitation of pedicels and podocyte hypertrophy in HFD, which was partially prevented by L and is consistent with the nephroprotective role of dopamine (31) and the harmful effect of Ang II on AT1R. (32)
HFD- induced MS is associated with HTN through RAS activation, particularly through the action of Ang II on AT1R, which stimulates the Na+K+ATPase pump, promoting sodium retention and reducing its excretion. (1,22) Concomitantly, HFD inhibits RDS activity, enhancing the anti- natriuretic effect. There is negative reciprocity between AT1R and D1R in PCT cells, where activation of one induces internalization and abolition of signaling of the other, acting as a unit of opposites together with Na+K+ATPase as a common target. (33) In normotensive humans, a negative interaction between RDS and RAS has been demonstrated in the regulation of renal sodium transport, dependent on sodium intake. (34) HFD increased renal expression of AT1R compared with C, in accordance with models of MS and RAS activation. (21) L showed a tendency toward reduction in HFDL, suggesting that longer times may be necessary to demonstrate the effect. In contrast, L normalized the L- dopa/dopamine index, which was increased in HFD vs. C, (35) evidencing greater tubular dopamine availability and urinary excretion associated with restoration of OCTN1,2,3 transporters. LAT2 and OCT2 were not modified, in contrast to fructose overload. (35) HFD increased D1R, which was prevented by L, and reduced D2R, unchanged by L, reflecting renal dopaminergic alteration (36). HFD significantly increased cortical Na+K+ATPase compared with C, a finding consistent with Deji et al. (9,37). L prevented this increase in HFDL, without modifying baseline values (CL vs. C), an effect explained by its allosteric action on AT1R- D1R. (21)
The L- dopa/dopamine index correlated positively with SBP and insulin, and negatively with UNa+V and OCTN1,2,3, which directly links RDS to blood pressure regulation and sodium balance, in interaction with insulin resistance. (38) L normalized these correlations by blocking AT1R and inhibiting Na+K+ATPase. Taken together, the results highlight the HFD- induced RDS- RAS imbalance and the potential of L to prevent associated renal and hemodynamic dysfunction.
In terms of inflammation, RDS exerts anti- inflammatory effects, while RAS potentiates them. (10,39) Renal dopamine, via D1R and D2R, attenuates the effects of Ang II by reducing inflammation and fibrosis (16). In contrast, HFD induced a proinflammatory environment with overexpression of NFkB1 and TGF-beta1, increased interstitial fibrosis, and activation of oxidative pathways. (3,11,39) L prevented these changes by blocking Ang II and allowing the protective action of RDS to reduce fibrosis and oxidative stress. (40)
In conclusion, preventive and continuous treatment with L significantly attenuated RAS activity and reactivated RDS. AT1R inhibition by losartan reduced the action of Na+K+ATPase and normalized D1R expression, restoring OCTN1,2,3 transporter levels favoring dopamine access to the tubular lumen. Consequently, urinary dopamine excretion increased, the L- dopa/dopamine index normalized, and interaction with D1R was enhanced, promoting natriuresis and restoring RDS- RAS balance. In addition, L improved interstitial fibrosis, generated an anti- inflammatory renal environment, and preserved PCT structure and podocyte ultrastructure.
Limitations
One of the limitations of the present study was that the expression of the total Na+K+ATPase pump was assessed, without discriminating between the phosphorylated or active form and the non- phosphorylated or inactive one. Moreover, the activity of this transporter was not measured, based on the working group's own background showing in a fructose overload model with L that there were no variations between the different experimental groups.
Furthermore, it was not possible to perform immunohistochemistry on either the RDS transporters or receptors, which would have provided information about the cellular location of the different proteins, possibly directly related to the functionality of these proteins.
As a complement to TEM, it would have been suitable to determine the expression of nephrin and podocayline as structural markers of glomerular filtration barrier integrity, as well as to determine the expression of IL-6 as an acute marker of inflammation complementary to NFkB1.
These assessments are planned for the future in order to complete the corresponding profile.
Conflicts of interest
None declared.
(See authors' conflict of interests forms on the web).
Funding
Funding was provided by research grants: 2014-2016: Project BA105 / 2014-2017: Project 20020130100019BA / 2018-2020 (extended until 2022): Project 20020170100621BA.